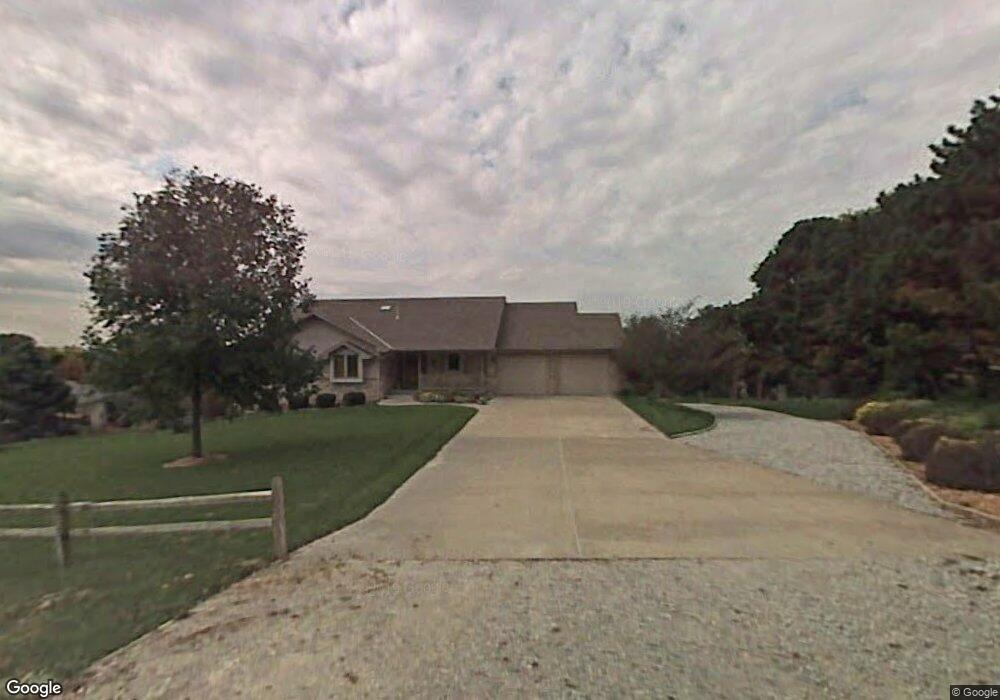
14704 S 227th St Gretna, NE 68028
Estimated Value: $577,000 - $747,000
3
Beds
4
Baths
3,294
Sq Ft
$199/Sq Ft
Est. Value
About This Home
This home is located at 14704 S 227th St, Gretna, NE 68028 and is currently estimated at $656,415, approximately $199 per square foot. 14704 S 227th St is a home located in Sarpy County with nearby schools including Gretna Elementary School, Gretna Middle School, and Gretna High School.
Ownership History
Date
Name
Owned For
Owner Type
Purchase Details
Closed on
Aug 26, 2025
Sold by
Tast Alan H and Tast Marcine D
Bought by
Tast Family Trust and Tast
Current Estimated Value
Purchase Details
Closed on
Aug 5, 2008
Sold by
Sutter Charles William and Sutter Deborah Sue
Bought by
Tast Alan H and Tast Marcine D
Home Financials for this Owner
Home Financials are based on the most recent Mortgage that was taken out on this home.
Original Mortgage
$322,050
Interest Rate
6.38%
Purchase Details
Closed on
Aug 20, 2004
Sold by
Calvin Ronald A and Calvin Patty L
Bought by
Sutter Charles William and Sutter Deborah Sue
Home Financials for this Owner
Home Financials are based on the most recent Mortgage that was taken out on this home.
Original Mortgage
$264,000
Interest Rate
6.12%
Create a Home Valuation Report for This Property
The Home Valuation Report is an in-depth analysis detailing your home's value as well as a comparison with similar homes in the area
Home Values in the Area
Average Home Value in this Area
Purchase History
| Date | Buyer | Sale Price | Title Company |
|---|---|---|---|
| Tast Family Trust | -- | None Listed On Document | |
| Tast Alan H | $348,000 | None Available | |
| Sutter Charles William | $330,000 | -- |
Source: Public Records
Mortgage History
| Date | Status | Borrower | Loan Amount |
|---|---|---|---|
| Previous Owner | Tast Alan H | $322,050 | |
| Previous Owner | Sutter Charles William | $264,000 | |
| Closed | Sutter Charles William | $66,000 |
Source: Public Records
Tax History Compared to Growth
Tax History
| Year | Tax Paid | Tax Assessment Tax Assessment Total Assessment is a certain percentage of the fair market value that is determined by local assessors to be the total taxable value of land and additions on the property. | Land | Improvement |
|---|---|---|---|---|
| 2025 | $8,267 | $634,902 | $143,028 | $491,874 |
| 2024 | $9,392 | $559,269 | $120,897 | $438,372 |
| 2023 | $9,392 | $510,230 | $118,602 | $391,628 |
| 2022 | $8,220 | $439,623 | $115,500 | $324,123 |
| 2021 | $7,442 | $406,213 | $110,743 | $295,470 |
| 2020 | $7,027 | $385,882 | $95,383 | $290,499 |
| 2019 | $6,776 | $373,166 | $83,033 | $290,133 |
| 2018 | $6,281 | $348,297 | $57,466 | $290,831 |
| 2017 | $6,230 | $344,617 | $54,553 | $290,064 |
| 2016 | $5,852 | $325,594 | $54,553 | $271,041 |
| 2015 | $6,061 | $340,142 | $69,505 | $270,637 |
| 2014 | $5,914 | $335,252 | $69,505 | $265,747 |
| 2012 | -- | $325,106 | $69,505 | $255,601 |
Source: Public Records
Map
Nearby Homes
- 16651 S 226th Plaza
- 13602 S 234 St
- Lot 24 Wynnwood
- Lot 8 Signal Hill
- 16555 S 222nd Plaza
- 16575 S 226th Plaza
- 16525 S 226th Plaza
- 16522 S 226th Plaza
- 16677 S 222nd Plaza
- 21804 Hackberry Dr
- Albany Plan at Gruenther Ridge
- Lansing Plan at Gruenther Ridge
- Madison Plan at Gruenther Ridge
- Lincoln Plan at Gruenther Ridge
- Harrisburg Plan at Gruenther Ridge
- Montgomery 1734 Plan at Gruenther Ridge
- Montgomery 1892 Plan at Gruenther Ridge
- Jackson Plan at Gruenther Ridge
- Montgomery 1922 Plan at Gruenther Ridge
- Pierre 1934 Plan at Gruenther Ridge
- 14610 S 227th St
- 14708 S 227th St
- 22615 Melia Rd
- 14705 S 227th St
- 14606 S 227th St
- 14802 S 227th St
- 22601 Melia Rd
- 22511 Melia Rd
- 20508 Melia Rd
- 22714 Melia Rd
- 22507 Melia Rd
- 22704 Highway 6
- 22850 Melia Rd
- 22410 Melia Rd
- 22502 Melia Rd
- 22503 Melia Rd
- 22608 Melia Rd
- 22704 Melia Rd
- 19803 Willow St
- 19816 Willow St