Estimated Value: $416,000 - $475,000
4
Beds
2
Baths
1,946
Sq Ft
$227/Sq Ft
Est. Value
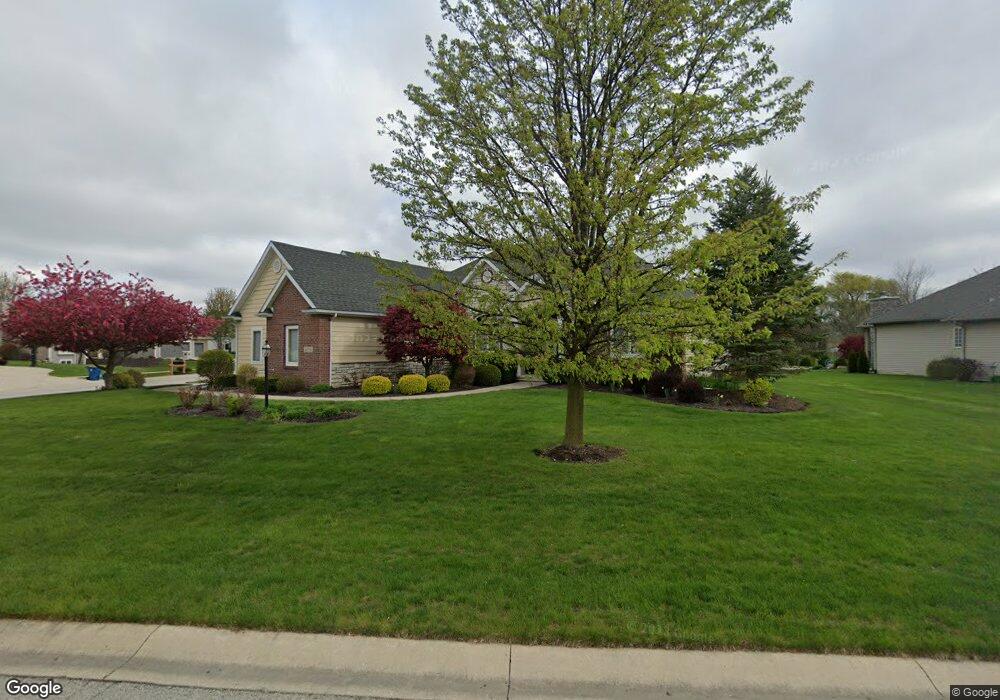
About This Home
This home is located at 14708 Flint Creek Crossing, Leo, IN 46765 and is currently estimated at $441,632, approximately $226 per square foot. 14708 Flint Creek Crossing is a home located in Allen County with nearby schools including Leo Elementary School, Cedarville Elementary School, and Leo Junior/Senior High School.
Ownership History
Date
Name
Owned For
Owner Type
Purchase Details
Closed on
May 19, 2021
Sold by
Miazga Walter C and Miazga Barbara A
Bought by
Miazga Walter C and Bach Lisa M
Current Estimated Value
Purchase Details
Closed on
Sep 13, 2006
Sold by
Account Homes By Liechty Inc
Bought by
Mlazga Walter C and Mlazga Barbara A
Purchase Details
Closed on
May 23, 2005
Sold by
Metea Llc
Bought by
Pioneer Village Inc
Home Financials for this Owner
Home Financials are based on the most recent Mortgage that was taken out on this home.
Original Mortgage
$200,000
Interest Rate
6.07%
Mortgage Type
Construction
Create a Home Valuation Report for This Property
The Home Valuation Report is an in-depth analysis detailing your home's value as well as a comparison with similar homes in the area
Home Values in the Area
Average Home Value in this Area
Purchase History
| Date | Buyer | Sale Price | Title Company |
|---|---|---|---|
| Miazga Walter C | -- | None Available | |
| Mlazga Walter C | -- | Metropolitan Title Of In Llc | |
| Accent Homes By Liachty Inc | -- | Metropolitan Title In Llc | |
| Pioneer Village Inc | -- | -- |
Source: Public Records
Mortgage History
| Date | Status | Borrower | Loan Amount |
|---|---|---|---|
| Previous Owner | Pioneer Village Inc | $200,000 |
Source: Public Records
Tax History Compared to Growth
Tax History
| Year | Tax Paid | Tax Assessment Tax Assessment Total Assessment is a certain percentage of the fair market value that is determined by local assessors to be the total taxable value of land and additions on the property. | Land | Improvement |
|---|---|---|---|---|
| 2024 | $3,828 | $402,400 | $63,600 | $338,800 |
| 2023 | $3,722 | $398,500 | $63,600 | $334,900 |
| 2022 | $3,355 | $355,700 | $63,600 | $292,100 |
| 2021 | $3,012 | $332,900 | $63,600 | $269,300 |
| 2020 | $2,879 | $311,800 | $63,600 | $248,200 |
| 2019 | $2,809 | $305,200 | $63,600 | $241,600 |
| 2018 | $2,815 | $294,500 | $63,600 | $230,900 |
| 2017 | $2,914 | $294,800 | $63,600 | $231,200 |
| 2016 | $2,824 | $287,400 | $63,600 | $223,800 |
| 2014 | $2,373 | $250,900 | $63,600 | $187,300 |
| 2013 | $2,428 | $251,800 | $63,600 | $188,200 |
Source: Public Records
Map
Nearby Homes
- 9116 Metea Valley Crossing
- 15188 Leo Creek Blvd
- 9318 Bobcat Trail
- 15026 Leo Creek Blvd
- 15154 Annabelle Place
- 15293 Leo Creek Blvd
- 14315 Flint Creek Crossing
- 15332 Annabelle Place
- 8578 Virgo Run
- 15309 Wild Meadow Place
- 8025 Hosler Rd
- 15114 Lions Passage
- 10135 Donald Ave
- 15208 Beulah Dr
- 13638 Leo Rd
- 13234 Leo Rd
- 15451 N State Road 1
- 15395 Makarios Pass Unit 32
- 15430 Makarios Pass Unit 6
- 15535 Makarios Pass Unit 37
- 8919 Metea Valley Crossing
- 14720 Flint Creek Crossing
- 14626 Flint Creek Crossing
- 14705 Flint Creek Crossing
- 14635 Flint Creek Crossing
- 8918 Metea Valley Crossing
- 14717 Flint Creek Crossing
- 14732 Flint Creek Crossing
- 14627 Flint Creek Crossing
- 14729 Flint Creek Crossing
- 14719 Greystone Ct
- 9010 Metea Valley Pkwy
- 9010 Metea Valley Crossing
- 14614 Flint Creek Crossing
- 14731 Greystone Ct
- 14707 Greystone Ct
- 14806 Flint Creek Crossing
- 14807 Flint Creek Crossing
- 14615 Flint Creek Crossing
- 14811 Greystone Ct