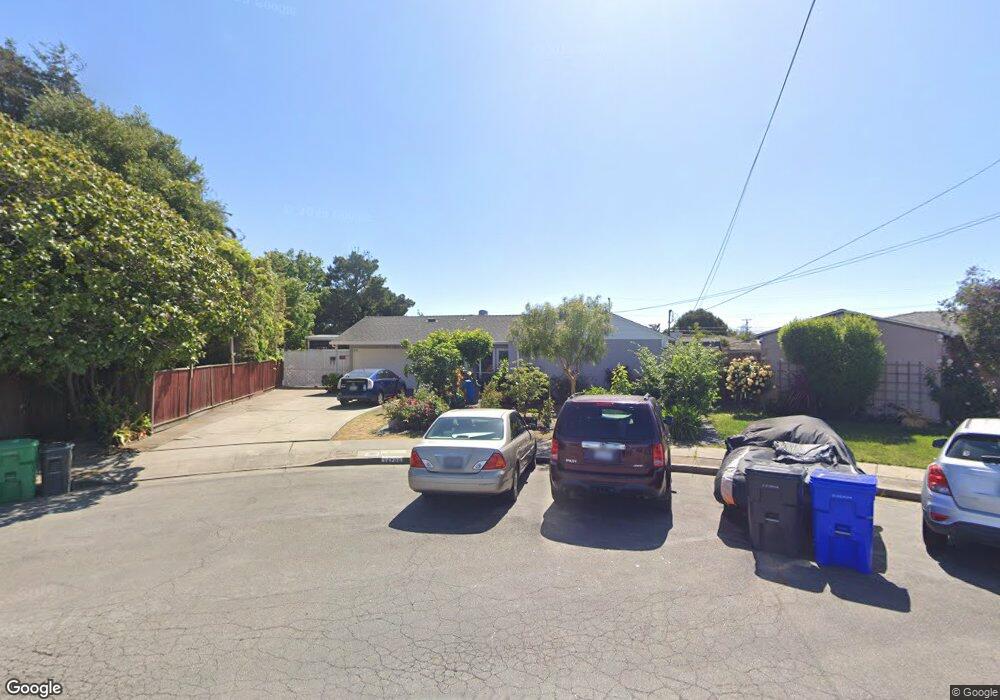
14709 Fisk Ct San Leandro, CA 94579
Washington Manor-Bonaire NeighborhoodEstimated Value: $689,000 - $905,000
3
Beds
2
Baths
1,177
Sq Ft
$701/Sq Ft
Est. Value
About This Home
This home is located at 14709 Fisk Ct, San Leandro, CA 94579 and is currently estimated at $825,120, approximately $701 per square foot. 14709 Fisk Ct is a home located in Alameda County with nearby schools including Dayton Elementary School, Washington Manor Middle School, and Arroyo High School.
Ownership History
Date
Name
Owned For
Owner Type
Purchase Details
Closed on
Oct 22, 2001
Sold by
Madrigal Toni
Bought by
Madrigal George
Current Estimated Value
Home Financials for this Owner
Home Financials are based on the most recent Mortgage that was taken out on this home.
Original Mortgage
$245,000
Interest Rate
6.84%
Purchase Details
Closed on
Oct 19, 2001
Sold by
Patterson Lucille and Madrigal George
Bought by
Thant Herson and Thant Cindy
Home Financials for this Owner
Home Financials are based on the most recent Mortgage that was taken out on this home.
Original Mortgage
$245,000
Interest Rate
6.84%
Purchase Details
Closed on
Mar 20, 1996
Sold by
Patterson Lucille and Madrigal George
Bought by
Nora Madrigal Living Trust
Purchase Details
Closed on
Apr 13, 1994
Sold by
Madrigal Nora
Bought by
Patterson Lucille and Madrigal George
Create a Home Valuation Report for This Property
The Home Valuation Report is an in-depth analysis detailing your home's value as well as a comparison with similar homes in the area
Home Values in the Area
Average Home Value in this Area
Purchase History
| Date | Buyer | Sale Price | Title Company |
|---|---|---|---|
| Madrigal George | -- | North American Title Co | |
| Thant Herson | $345,000 | North American Title Co | |
| Nora Madrigal Living Trust | -- | -- | |
| Patterson Lucille | -- | -- |
Source: Public Records
Mortgage History
| Date | Status | Borrower | Loan Amount |
|---|---|---|---|
| Previous Owner | Thant Herson | $245,000 |
Source: Public Records
Tax History Compared to Growth
Tax History
| Year | Tax Paid | Tax Assessment Tax Assessment Total Assessment is a certain percentage of the fair market value that is determined by local assessors to be the total taxable value of land and additions on the property. | Land | Improvement |
|---|---|---|---|---|
| 2025 | $6,546 | $509,633 | $152,890 | $356,743 |
| 2024 | $6,546 | $499,641 | $149,892 | $349,749 |
| 2023 | $6,518 | $489,847 | $146,954 | $342,893 |
| 2022 | $6,422 | $480,243 | $144,073 | $336,170 |
| 2021 | $6,245 | $470,827 | $141,248 | $329,579 |
| 2020 | $6,108 | $466,001 | $139,800 | $326,201 |
| 2019 | $6,119 | $456,865 | $137,059 | $319,806 |
| 2018 | $5,774 | $447,910 | $134,373 | $313,537 |
| 2017 | $5,507 | $439,128 | $131,738 | $307,390 |
| 2016 | $5,378 | $430,521 | $129,156 | $301,365 |
| 2015 | $5,261 | $424,056 | $127,217 | $296,839 |
| 2014 | $5,184 | $415,751 | $124,725 | $291,026 |
Source: Public Records
Map
Nearby Homes
- 14666 Wiley St
- 1315 Mersey Ave
- 1875 Willow Ave
- 1803 Cedar Ave
- 14820 Crosby St
- 15102 Chapel Ct
- 3419 Del Valle Cir
- 774 Hamlin Way
- 3811 Yorkshire St Unit 2
- 3411 Del Monte Way
- 585 Majestic Way Unit 40
- 688 Garside Ct
- 365 Caliente Cir
- 829 Crespi Dr
- 112 Santa Teresa
- 117 Santa Teresa
- 391 Anza Way
- 509 Santa Ynez
- 14617 Doolittle Dr
- 14587 Doolittle Dr