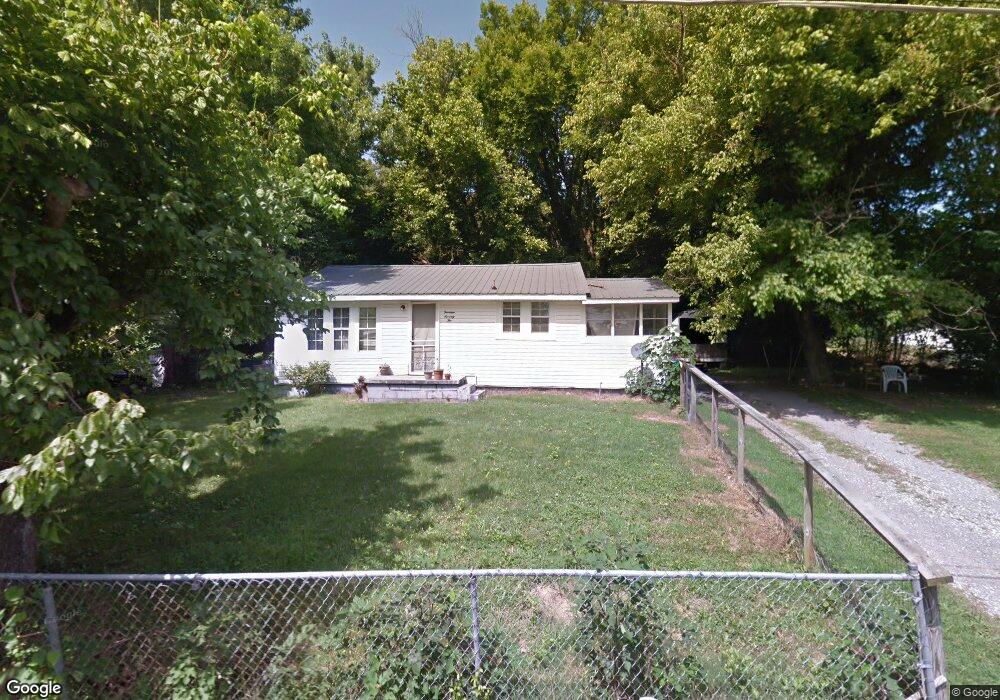
1472 Short St Morristown, TN 37814
Estimated Value: $101,000 - $153,000
--
Bed
1
Bath
908
Sq Ft
$131/Sq Ft
Est. Value
About This Home
This home is located at 1472 Short St, Morristown, TN 37814 and is currently estimated at $118,940, approximately $130 per square foot. 1472 Short St is a home located in Hamblen County with nearby schools including Fairview-Marguerite Elementary School, Meadowview Middle School, and Morristown East High School.
Ownership History
Date
Name
Owned For
Owner Type
Purchase Details
Closed on
Jan 13, 2021
Sold by
Ivy Keith
Bought by
Ivy Shelia A
Current Estimated Value
Home Financials for this Owner
Home Financials are based on the most recent Mortgage that was taken out on this home.
Original Mortgage
$85,500
Outstanding Balance
$76,309
Interest Rate
2.71%
Mortgage Type
New Conventional
Estimated Equity
$42,631
Purchase Details
Closed on
Feb 28, 2020
Sold by
Samples Brad
Bought by
Ivy Keith
Purchase Details
Closed on
Aug 5, 2008
Sold by
Ivy Keith
Bought by
Rogers Jerry
Purchase Details
Closed on
Mar 22, 2005
Sold by
Kilgore Grayland D
Bought by
Rogers Jerry
Home Financials for this Owner
Home Financials are based on the most recent Mortgage that was taken out on this home.
Original Mortgage
$21,000
Interest Rate
5.57%
Purchase Details
Closed on
Oct 13, 1989
Bought by
Kilgore Howard and Kilgore Grayland D
Purchase Details
Closed on
May 22, 1985
Bought by
Trent Kathy B
Create a Home Valuation Report for This Property
The Home Valuation Report is an in-depth analysis detailing your home's value as well as a comparison with similar homes in the area
Home Values in the Area
Average Home Value in this Area
Purchase History
| Date | Buyer | Sale Price | Title Company |
|---|---|---|---|
| Ivy Shelia A | $90,000 | Lakeway Title Services | |
| Ivy Keith | $4,009 | None Available | |
| Rogers Jerry | -- | -- | |
| Rogers Jerry | $28,814 | -- | |
| Kilgore Howard | $22,000 | -- | |
| Trent Kathy B | -- | -- |
Source: Public Records
Mortgage History
| Date | Status | Borrower | Loan Amount |
|---|---|---|---|
| Open | Ivy Shelia A | $85,500 | |
| Previous Owner | Trent Kathy B | $21,000 |
Source: Public Records
Tax History Compared to Growth
Tax History
| Year | Tax Paid | Tax Assessment Tax Assessment Total Assessment is a certain percentage of the fair market value that is determined by local assessors to be the total taxable value of land and additions on the property. | Land | Improvement |
|---|---|---|---|---|
| 2024 | $248 | $14,100 | $1,975 | $12,125 |
| 2023 | $248 | $14,100 | $0 | $0 |
| 2022 | $445 | $14,100 | $1,975 | $12,125 |
| 2021 | $504 | $14,100 | $1,975 | $12,125 |
| 2020 | $445 | $14,100 | $1,975 | $12,125 |
| 2019 | $415 | $12,200 | $2,375 | $9,825 |
| 2018 | $385 | $12,200 | $2,375 | $9,825 |
| 2017 | $378 | $12,200 | $2,375 | $9,825 |
| 2016 | $361 | $12,200 | $2,375 | $9,825 |
| 2015 | $336 | $12,200 | $2,375 | $9,825 |
| 2014 | -- | $12,200 | $2,375 | $9,825 |
| 2013 | -- | $12,850 | $0 | $0 |
Source: Public Records
Map
Nearby Homes
- 1420 Buffalo Trail
- 000 Devault St
- 1542 Shields Ferry Rd
- 1562 Shields Ferry Rd
- 1215 Shields Ferry Rd
- 1324 Davis St
- 637 Carriger St
- 1449 N Easley Ct
- 1111 Carmichael St
- 602 Hilltop Dr
- 1101 Sherwood Dr
- 1323 Goodson Ave
- 2358 Stream View Ln
- 551 Callaway Dr
- 439 Lochmere Dr
- 573 Kensington Dr
- 472 Lochmere Dr
- 2151 Thomas Dr
- 2951/2945 Cherokee Dr
- 446 Lochmere Greene Dr