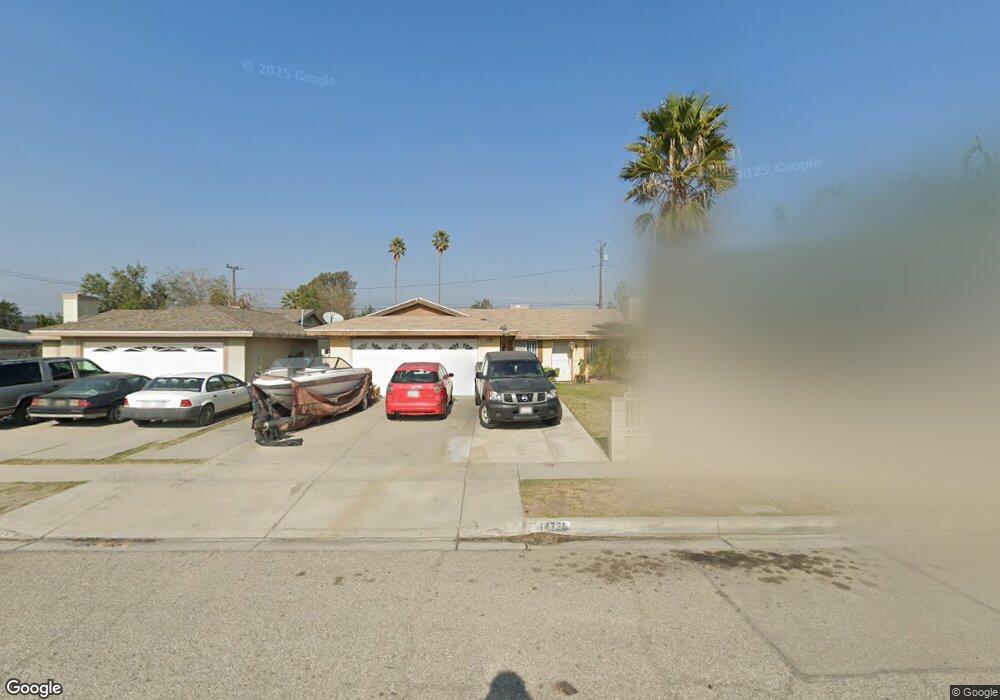
14726 Mallory Dr Fontana, CA 92335
Estimated Value: $530,000 - $575,000
3
Beds
2
Baths
1,098
Sq Ft
$503/Sq Ft
Est. Value
About This Home
This home is located at 14726 Mallory Dr, Fontana, CA 92335 and is currently estimated at $552,378, approximately $503 per square foot. 14726 Mallory Dr is a home located in San Bernardino County with nearby schools including Poplar Elementary School, Sequoia Middle School, and Henry J. Kaiser High School.
Ownership History
Date
Name
Owned For
Owner Type
Purchase Details
Closed on
Jun 9, 2011
Sold by
Zelada Jova Leticia
Bought by
Garabet Antoine and Garabet Carmen
Current Estimated Value
Purchase Details
Closed on
Jun 6, 2006
Sold by
Zelada Manuel
Bought by
Zelada Jova Leticia
Home Financials for this Owner
Home Financials are based on the most recent Mortgage that was taken out on this home.
Original Mortgage
$38,000
Interest Rate
6.55%
Mortgage Type
Credit Line Revolving
Purchase Details
Closed on
May 8, 2006
Sold by
Orozco Noemi R
Bought by
Zelada Jova Leticia
Home Financials for this Owner
Home Financials are based on the most recent Mortgage that was taken out on this home.
Original Mortgage
$38,000
Interest Rate
6.55%
Mortgage Type
Credit Line Revolving
Purchase Details
Closed on
Jul 17, 2003
Sold by
Orozco Roberto A and Orozco Noemi R
Bought by
Orozco Noemi R
Create a Home Valuation Report for This Property
The Home Valuation Report is an in-depth analysis detailing your home's value as well as a comparison with similar homes in the area
Home Values in the Area
Average Home Value in this Area
Purchase History
| Date | Buyer | Sale Price | Title Company |
|---|---|---|---|
| Garabet Antoine | $135,000 | Landwood Title | |
| Zelada Jova Leticia | -- | Orange Coast Title | |
| Zelada Jova Leticia | $380,000 | Orange Coast Title | |
| Orozco Noemi R | -- | -- |
Source: Public Records
Mortgage History
| Date | Status | Borrower | Loan Amount |
|---|---|---|---|
| Previous Owner | Zelada Jova Leticia | $38,000 | |
| Previous Owner | Zelada Jova Leticia | $304,000 |
Source: Public Records
Tax History Compared to Growth
Tax History
| Year | Tax Paid | Tax Assessment Tax Assessment Total Assessment is a certain percentage of the fair market value that is determined by local assessors to be the total taxable value of land and additions on the property. | Land | Improvement |
|---|---|---|---|---|
| 2025 | $1,809 | $172,962 | $43,241 | $129,721 |
| 2024 | $1,809 | $169,570 | $42,393 | $127,177 |
| 2023 | $1,762 | $166,245 | $41,562 | $124,683 |
| 2022 | $1,755 | $162,985 | $40,747 | $122,238 |
| 2021 | $1,733 | $159,789 | $39,948 | $119,841 |
| 2020 | $1,729 | $158,150 | $39,538 | $118,612 |
| 2019 | $1,677 | $155,049 | $38,763 | $116,286 |
| 2018 | $1,702 | $152,009 | $38,003 | $114,006 |
| 2017 | $1,693 | $149,029 | $37,258 | $111,771 |
| 2016 | $1,665 | $146,106 | $36,527 | $109,579 |
| 2015 | $1,644 | $143,911 | $35,978 | $107,933 |
| 2014 | $1,640 | $141,092 | $35,273 | $105,819 |
Source: Public Records
Map
Nearby Homes
- 14582 El Molino St
- 17377 20 Valley Blvd
- 9828 Carob Ave
- 15162 Cambria St
- 9326 Bunny Ln
- 10238 Cherry Ave
- 15240 Carob Ln
- 9310 Carob St
- 9756 Elm Ave
- 15278 Boyle Ave
- 14989 Hibiscus Ave
- 15065 Granada Ct
- 15317 Athol St
- 9963 Eugenia Ave
- 9059 Beech Ave
- 9408 Poplar Ave
- 15082 Valley Blvd
- 14770 Boyle Ave
- 10566 Calabash Ave
- 15937 Manzanita Dr
- 14714 Mallory Dr
- 14738 Mallory Dr
- 14750 Mallory Dr
- 14725 El Molino St
- 9855 Redwood Ave
- 14715 El Molino St
- 14735 El Molino St
- 14706 Mallory Dr
- 14745 El Molino St
- 14705 El Molino St
- 14762 Mallory Dr
- 14725 Mallory Dr
- 14737 Mallory Dr
- 14713 Mallory Dr
- 14749 Mallory Dr
- 14755 El Molino St
- 9879 Redwood Ave
- 14774 Mallory Dr
- 14755 Mallory Dr
- 9825 Redwood Ave