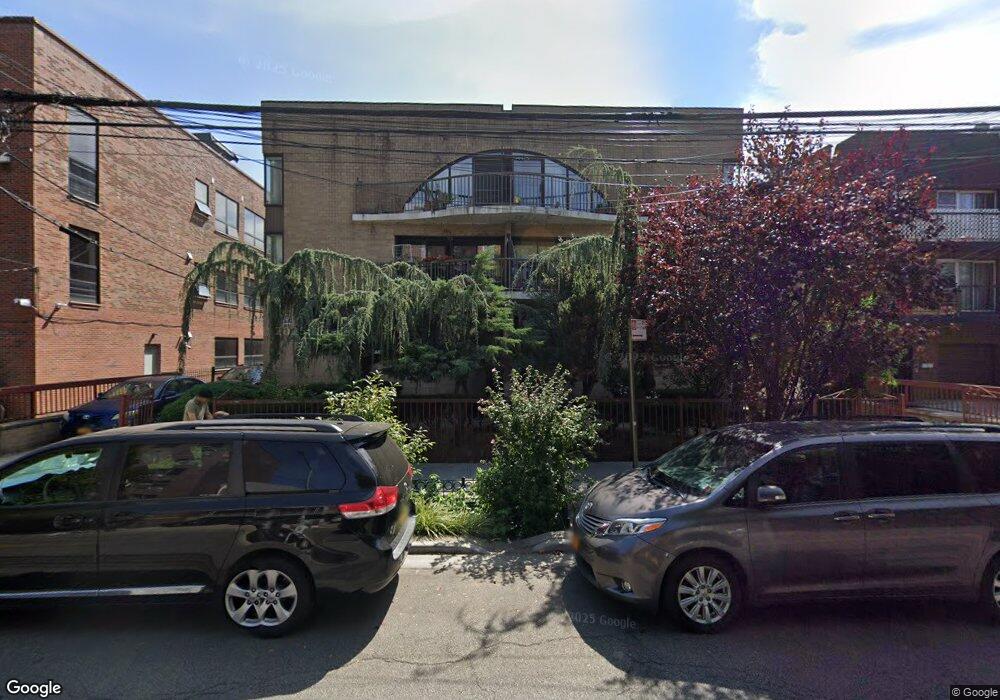
14726 Roosevelt Ave Unit 1B Flushing, NY 11354
Flushing NeighborhoodEstimated Value: $664,000 - $686,436
--
Bed
--
Bath
1,069
Sq Ft
$629/Sq Ft
Est. Value
About This Home
This home is located at 14726 Roosevelt Ave Unit 1B, Flushing, NY 11354 and is currently estimated at $672,109, approximately $628 per square foot. 14726 Roosevelt Ave Unit 1B is a home located in Queens County with nearby schools including P.S. 22 - Thomas Jefferson, J.H.S. 189Q Daniel Carter Beard, and Flushing High School.
Ownership History
Date
Name
Owned For
Owner Type
Purchase Details
Closed on
Sep 17, 2020
Sold by
Lim Fang Tiang and Wong Chau Thai
Bought by
Li Elaine and Li Hua
Current Estimated Value
Home Financials for this Owner
Home Financials are based on the most recent Mortgage that was taken out on this home.
Original Mortgage
$510,000
Outstanding Balance
$450,531
Interest Rate
2.9%
Mortgage Type
New Conventional
Estimated Equity
$221,578
Purchase Details
Closed on
Jul 12, 2000
Sold by
Ho Betty and Chen Robert
Bought by
Ho Betty and Chen Nancy Yen Ju
Home Financials for this Owner
Home Financials are based on the most recent Mortgage that was taken out on this home.
Original Mortgage
$123,000
Interest Rate
8.06%
Purchase Details
Closed on
Nov 5, 1994
Sold by
Li Kong Ling and Li Ming Chu
Bought by
Li Kong Ling
Create a Home Valuation Report for This Property
The Home Valuation Report is an in-depth analysis detailing your home's value as well as a comparison with similar homes in the area
Home Values in the Area
Average Home Value in this Area
Purchase History
| Date | Buyer | Sale Price | Title Company |
|---|---|---|---|
| Li Elaine | $650,000 | -- | |
| Li Elaine | $650,000 | -- | |
| Ho Betty | -- | Titleserv | |
| Ho Betty | -- | Titleserv | |
| Li Kong Ling | -- | Chicago Title Insurance Co | |
| Li Kong Ling | -- | Chicago Title Insurance Co |
Source: Public Records
Mortgage History
| Date | Status | Borrower | Loan Amount |
|---|---|---|---|
| Open | Li Elaine | $510,000 | |
| Closed | Li Elaine | $510,000 | |
| Previous Owner | Ho Betty | $123,000 |
Source: Public Records
Tax History Compared to Growth
Tax History
| Year | Tax Paid | Tax Assessment Tax Assessment Total Assessment is a certain percentage of the fair market value that is determined by local assessors to be the total taxable value of land and additions on the property. | Land | Improvement |
|---|---|---|---|---|
| 2025 | $8,516 | $71,043 | $5,440 | $65,603 |
| 2024 | $7,026 | $68,121 | $5,440 | $62,681 |
| 2023 | $8,130 | $65,026 | $5,440 | $59,586 |
| 2022 | $7,710 | $70,877 | $5,440 | $65,437 |
| 2021 | $6,936 | $56,539 | $5,440 | $51,099 |
| 2020 | $7,579 | $63,994 | $5,440 | $58,554 |
| 2019 | $7,346 | $62,791 | $5,440 | $57,351 |
| 2018 | $6,684 | $55,773 | $5,440 | $50,333 |
| 2017 | $6,684 | $52,551 | $5,440 | $47,111 |
| 2016 | $6,373 | $52,551 | $5,440 | $47,111 |
| 2015 | $3,643 | $46,099 | $5,440 | $40,659 |
Source: Public Records
Map
Nearby Homes
- 147-26 Roosevelt Ave Unit L1
- 144-85 Roosevelt Ave Unit 5E
- 38-15 149th St Unit 1S
- 38-15 149th St Unit 3V
- 38-15 149th St Unit 6H
- 38-15 149th St Unit 1A
- 38-15 149th St Unit 3C
- 147- 25 38th Ave Unit F26
- 38-08 147 St Unit C2
- 38-08 147th St Unit 6E
- 144-70 41st Ave Unit 4D
- 144-56 Roosevelt Ave Unit 5B
- 147-30 Barclay Ave Unit 3B
- 147-37 38th Ave Unit C61
- 147-37 38th Ave Unit C66
- 14737 38th Ave Unit C23
- 14737 38th Ave Unit C54
- 14737 38th Ave Unit C48
- 147-31 38th Ave Unit A68
- 147-31 38th Ave Unit A33
- 14726 Roosevelt Ave Unit C1
- 14726 Roosevelt Ave Unit 3C
- 14726 Roosevelt Ave Unit 3B
- 14726 Roosevelt Ave Unit 3A
- 14726 Roosevelt Ave Unit 2D
- 14726 Roosevelt Ave Unit 2C
- 14726 Roosevelt Ave Unit 2B
- 14726 Roosevelt Ave Unit 2A
- 14726 Roosevelt Ave Unit 1D
- 14726 Roosevelt Ave Unit 1C
- 14726 Roosevelt Ave Unit 1A
- 14726 Roosevelt Ave Unit L2
- 14726 Roosevelt Ave Unit L1
- 14726 Roosevelt Ave Unit PAR10
- 14726 Roosevelt Ave Unit PARK3
- 14726 Roosevelt Ave Unit PARK5
- 14726 Roosevelt Ave Unit PAR11
- 14726 Roosevelt Ave Unit MED3
- 14726 Roosevelt Ave
- 14726 Roosevelt Ave Unit PARK2