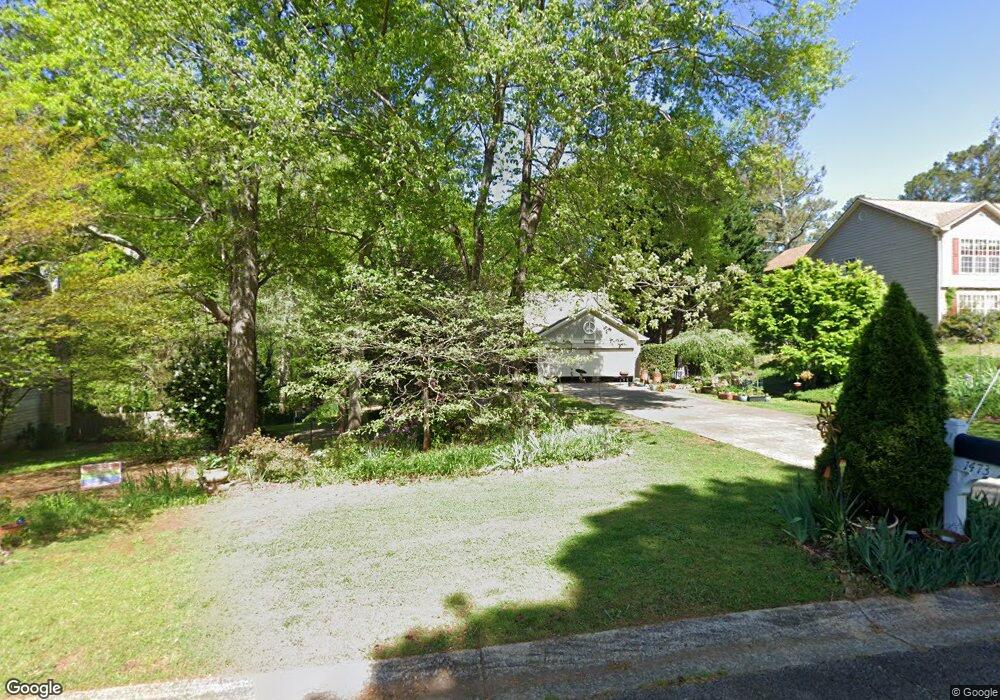
1473 Riverbend Ct Bethlehem, GA 30620
Estimated Value: $295,000 - $368,000
--
Bed
3
Baths
1,464
Sq Ft
$224/Sq Ft
Est. Value
About This Home
This home is located at 1473 Riverbend Ct, Bethlehem, GA 30620 and is currently estimated at $328,523, approximately $224 per square foot. 1473 Riverbend Ct is a home located in Barrow County with nearby schools including Yargo Elementary School, Haymon-Morris Middle School, and Apalachee High School.
Ownership History
Date
Name
Owned For
Owner Type
Purchase Details
Closed on
Aug 22, 2017
Sold by
Smith Doreen C
Bought by
Cochran Doreen and Ifill Victoria
Current Estimated Value
Home Financials for this Owner
Home Financials are based on the most recent Mortgage that was taken out on this home.
Original Mortgage
$99,900
Outstanding Balance
$83,269
Interest Rate
3.92%
Mortgage Type
New Conventional
Estimated Equity
$245,254
Purchase Details
Closed on
Feb 2, 2006
Sold by
Smith Alan D
Bought by
Smith Doreen C
Purchase Details
Closed on
Feb 20, 1996
Sold by
Gary Reeves Construction Co Inc
Bought by
Cochran Doreen
Purchase Details
Closed on
Mar 21, 1995
Sold by
Dun La Hur Deve L
Bought by
Reeves Constr
Purchase Details
Closed on
Nov 29, 1993
Bought by
Developme Dun La Hur
Create a Home Valuation Report for This Property
The Home Valuation Report is an in-depth analysis detailing your home's value as well as a comparison with similar homes in the area
Home Values in the Area
Average Home Value in this Area
Purchase History
| Date | Buyer | Sale Price | Title Company |
|---|---|---|---|
| Cochran Doreen | -- | -- | |
| Smith Doreen C | -- | -- | |
| Cochran Doreen | $106,900 | -- | |
| Reeves Constr | $15,000 | -- | |
| Construc Gary Reeves | $15,000 | -- | |
| Developme Dun La Hur | -- | -- |
Source: Public Records
Mortgage History
| Date | Status | Borrower | Loan Amount |
|---|---|---|---|
| Open | Cochran Doreen | $99,900 | |
| Closed | Construc Gary Reeves | $0 |
Source: Public Records
Tax History Compared to Growth
Tax History
| Year | Tax Paid | Tax Assessment Tax Assessment Total Assessment is a certain percentage of the fair market value that is determined by local assessors to be the total taxable value of land and additions on the property. | Land | Improvement |
|---|---|---|---|---|
| 2024 | $1,437 | $108,908 | $21,600 | $87,308 |
| 2023 | $1,043 | $109,308 | $21,600 | $87,708 |
| 2022 | $1,036 | $87,005 | $21,600 | $65,405 |
| 2021 | $833 | $72,918 | $16,800 | $56,118 |
| 2020 | $748 | $65,275 | $13,800 | $51,475 |
| 2019 | $780 | $65,275 | $13,800 | $51,475 |
| 2018 | $755 | $65,275 | $13,800 | $51,475 |
| 2017 | $1,454 | $49,944 | $13,800 | $36,144 |
| 2016 | $1,388 | $48,612 | $13,800 | $34,812 |
| 2015 | $1,407 | $49,037 | $13,800 | $35,237 |
| 2014 | $1,218 | $42,424 | $6,762 | $35,662 |
| 2013 | -- | $40,621 | $6,762 | $33,859 |
Source: Public Records
Map
Nearby Homes
- 840 N Cross Lane Rd
- 384 Winslow Ct
- 286 Meadows Dr
- 103 Camp Ct
- 637 Sleeping Meadow Ln
- 0 Tanners Bridge Rd Unit 10588144
- 1381 Loganville Hwy
- 8275 Highway 81
- 7357 Raleigh Way
- 1035 Lucienne Blvd
- 1047 Lucienne Blvd
- 8215 Highway 81
- 763 Moss Side Dr
- 8165 Highway 81
- 8255 Shadow Creek Dr
- 8345 Shadow Creek Dr
- 8125 Highway 81
- 934 Beaver Hill Dr
- 1071 Covenant Ct
- 960 Providence Ln
- 1471 Riverbend Ct
- 1475 Riverbend Ct
- 655 Rivermill Rd
- 1477 Riverbend Ct
- 1470 Riverbend Ct
- 1476 Riverbend Ct
- 653 Rivermill Rd
- 660 Rivermill Rd
- 658 Rivermill Rd
- 1479 Riverbend Ct
- 656 Rivermill Rd
- 651 Rivermill Rd
- 669 Rivermill Rd
- 664 Rivermill Rd
- 654 Rivermill Rd
- 1482 Riverbend Ct
- 652 Rivermill Rd
- 1481 Riverbend Ct
- 649 Rivermill Rd
- 671 Rivermill Rd