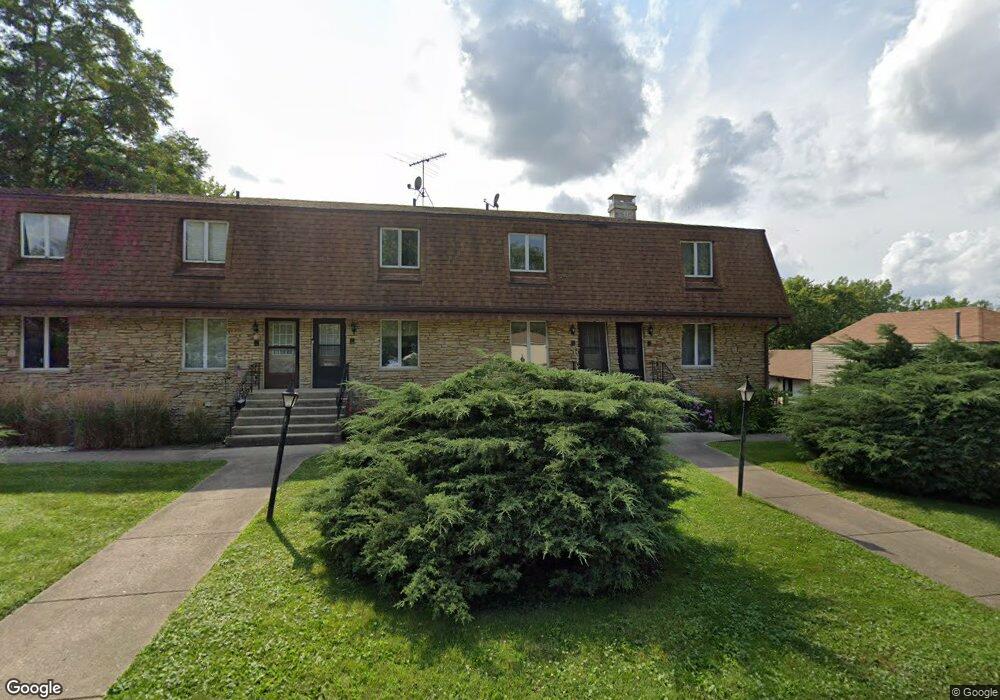
14730 S Penn Rd Unit 5 Plainfield, IL 60544
East Plainfield NeighborhoodEstimated Value: $219,000 - $263,000
2
Beds
3
Baths
1,088
Sq Ft
$223/Sq Ft
Est. Value
About This Home
This home is located at 14730 S Penn Rd Unit 5, Plainfield, IL 60544 and is currently estimated at $242,525, approximately $222 per square foot. 14730 S Penn Rd Unit 5 is a home located in Will County with nearby schools including Central Elementary School, Indian Trail Middle School, and Plainfield Central High School.
Ownership History
Date
Name
Owned For
Owner Type
Purchase Details
Closed on
Oct 25, 2006
Sold by
Allen Properties Group Inc
Bought by
Allen Steven
Current Estimated Value
Home Financials for this Owner
Home Financials are based on the most recent Mortgage that was taken out on this home.
Original Mortgage
$136,000
Outstanding Balance
$87,789
Interest Rate
7.99%
Mortgage Type
Commercial
Estimated Equity
$154,736
Purchase Details
Closed on
Oct 21, 2005
Sold by
Ambrose Matthew R
Bought by
Allen Properties Group Inc
Purchase Details
Closed on
Mar 26, 2001
Sold by
Jensen Anna Mae
Bought by
Ambrose Matthew R
Home Financials for this Owner
Home Financials are based on the most recent Mortgage that was taken out on this home.
Original Mortgage
$88,000
Interest Rate
7.02%
Purchase Details
Closed on
Jul 31, 2000
Sold by
Speicher William H and Speicher Lorraine H
Bought by
Filippo Robert and Filippo Debra
Create a Home Valuation Report for This Property
The Home Valuation Report is an in-depth analysis detailing your home's value as well as a comparison with similar homes in the area
Home Values in the Area
Average Home Value in this Area
Purchase History
| Date | Buyer | Sale Price | Title Company |
|---|---|---|---|
| Allen Steven | -- | Stewart Title Company | |
| Allen Properties Group Inc | $158,000 | Ticor Title | |
| Ambrose Matthew R | $110,000 | Ticor Title | |
| Filippo Robert | $114,000 | Chicago Title Insurance Co |
Source: Public Records
Mortgage History
| Date | Status | Borrower | Loan Amount |
|---|---|---|---|
| Open | Allen Steven | $136,000 | |
| Previous Owner | Ambrose Matthew R | $88,000 |
Source: Public Records
Tax History
| Year | Tax Paid | Tax Assessment Tax Assessment Total Assessment is a certain percentage of the fair market value that is determined by local assessors to be the total taxable value of land and additions on the property. | Land | Improvement |
|---|---|---|---|---|
| 2024 | $5,589 | $75,812 | $1 | $75,811 |
| 2023 | $5,589 | $68,472 | $1 | $68,471 |
| 2022 | $4,992 | $61,497 | $1 | $61,496 |
| 2021 | $4,732 | $57,474 | $1 | $57,473 |
| 2020 | $4,672 | $55,843 | $1 | $55,842 |
| 2019 | $4,519 | $53,209 | $1 | $53,208 |
| 2018 | $4,334 | $49,992 | $1 | $49,991 |
| 2017 | $4,213 | $47,507 | $1 | $47,506 |
| 2016 | $4,122 | $45,310 | $1 | $45,309 |
| 2015 | $4,009 | $42,445 | $1 | $42,444 |
| 2014 | $4,009 | $41,836 | $8,891 | $32,945 |
| 2013 | $4,009 | $41,836 | $8,891 | $32,945 |
Source: Public Records
Map
Nearby Homes
- 14816 S Penn Rd
- 23909 W Main St
- 25503 W Emory Ln
- 000 Wood Farm Rd
- 14632 S Kearns Dr
- 25518 W Stockwell Dr
- 14860 S Henebry Ln
- 15037 S Darr Dr
- 25500 W Alabaster Cir
- 14853 S Henebry Ln
- 14953 S Mccarthy Cir
- 15001 S Darr Dr
- 25450 W Alabaster Cir
- 14959 S Mccarthy Cir
- 25531 W Alabaster Cir
- 25508 W Alabaster Cir
- 25435 W Alabaster Cir
- 14849 S Henebry Ln
- 14955 S Mccarthy Cir
- 14949 S Mccarthy Cir
- 14732 S Penn Rd
- 14730 S Penn Rd
- 14734 S Penn Rd
- 14736 S Penn Rd
- 14736 S Penn Rd
- 14736 S Penn Rd Unit 2
- 14728 S Penn Rd
- 14738 S Penn Rd
- 14802 S Penn Rd
- 14801 S Penn Rd
- 14801 S Penn Rd Unit 14801
- 14733 S Penn Rd
- 14803 S Penn Rd
- 14724 S Penn Rd
- 14806 S Penn Rd
- 14805 S Penn Rd
- 14725 S Penn Rd Unit 11
- 14725 S Penn Rd Unit 9
- 14725 S Penn Rd Unit 10
- 14725 S Penn Rd
Your Personal Tour Guide
Ask me questions while you tour the home.