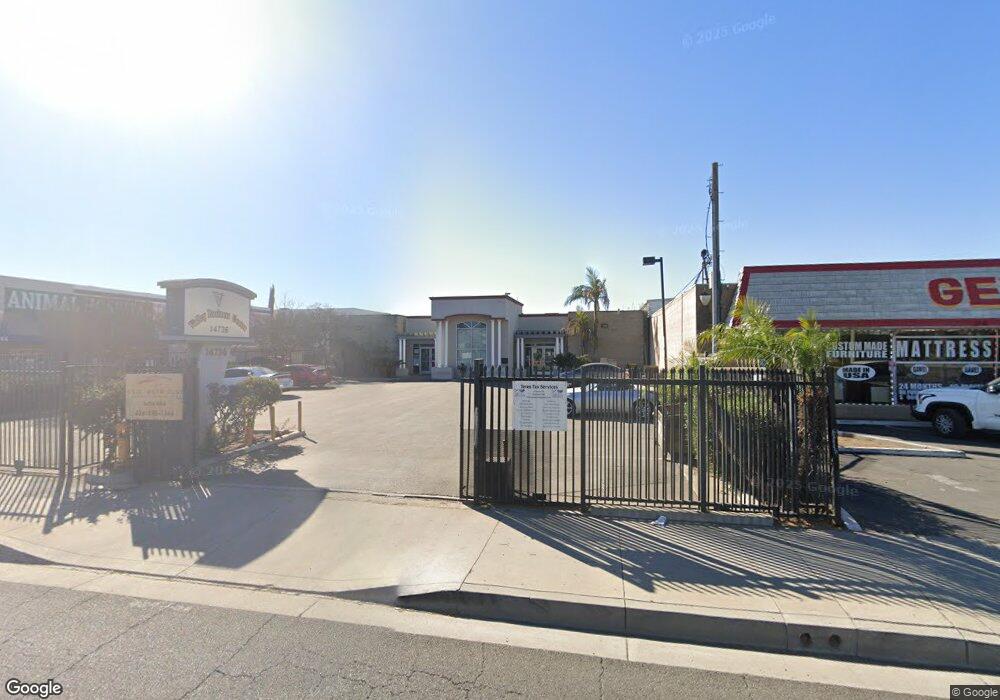
14736 Valley Blvd La Puente, CA 91746
Avocado Heights NeighborhoodEstimated Value: $2,391,586
--
Bed
--
Bath
7,240
Sq Ft
$330/Sq Ft
Est. Value
About This Home
This home is located at 14736 Valley Blvd, La Puente, CA 91746 and is currently estimated at $2,391,586, approximately $330 per square foot. 14736 Valley Blvd is a home located in Los Angeles County with nearby schools including Palm Elementary School, Orange Grove Middle School, and Los Altos High School.
Ownership History
Date
Name
Owned For
Owner Type
Purchase Details
Closed on
Jul 25, 2013
Sold by
Quezada Ramon
Bought by
Zhang Wei Dong and Zhang Ni Yan
Current Estimated Value
Home Financials for this Owner
Home Financials are based on the most recent Mortgage that was taken out on this home.
Original Mortgage
$763,750
Interest Rate
4.36%
Mortgage Type
Commercial
Purchase Details
Closed on
Sep 25, 2005
Sold by
Ingram Lavern R and Ingram Jane A
Bought by
Quezada Ramon
Home Financials for this Owner
Home Financials are based on the most recent Mortgage that was taken out on this home.
Original Mortgage
$750,000
Interest Rate
5.68%
Mortgage Type
Seller Take Back
Purchase Details
Closed on
Apr 9, 1999
Sold by
Rust White Kendall N Trs K N And A M Wh
Bought by
Ingram Lavern M
Home Financials for this Owner
Home Financials are based on the most recent Mortgage that was taken out on this home.
Original Mortgage
$250,000
Interest Rate
7.04%
Mortgage Type
Commercial
Create a Home Valuation Report for This Property
The Home Valuation Report is an in-depth analysis detailing your home's value as well as a comparison with similar homes in the area
Home Values in the Area
Average Home Value in this Area
Purchase History
| Date | Buyer | Sale Price | Title Company |
|---|---|---|---|
| Zhang Wei Dong | $1,175,000 | Ticor Title Company | |
| Quezada Ramon | $1,170,000 | Chicago Title Ins Co | |
| Ingram Lavern M | $237,500 | Fidelity National Title Co |
Source: Public Records
Mortgage History
| Date | Status | Borrower | Loan Amount |
|---|---|---|---|
| Previous Owner | Zhang Wei Dong | $763,750 | |
| Previous Owner | Quezada Ramon | $750,000 | |
| Previous Owner | Ingram Lavern M | $250,000 |
Source: Public Records
Tax History Compared to Growth
Tax History
| Year | Tax Paid | Tax Assessment Tax Assessment Total Assessment is a certain percentage of the fair market value that is determined by local assessors to be the total taxable value of land and additions on the property. | Land | Improvement |
|---|---|---|---|---|
| 2025 | $19,048 | $1,440,378 | $858,100 | $582,278 |
| 2024 | $19,048 | $1,412,136 | $841,275 | $570,861 |
| 2023 | $18,587 | $1,384,448 | $824,780 | $559,668 |
| 2022 | $18,062 | $1,357,303 | $808,608 | $548,695 |
| 2021 | $17,723 | $1,330,690 | $792,753 | $537,937 |
| 2020 | $21,397 | $1,661,580 | $845,580 | $816,000 |
| 2019 | $17,226 | $1,291,224 | $769,241 | $521,983 |
| 2018 | $16,572 | $1,265,907 | $754,158 | $511,749 |
| 2016 | $15,342 | $1,216,752 | $724,874 | $491,878 |
| 2015 | $15,059 | $1,198,476 | $713,986 | $484,490 |
| 2014 | $14,817 | $1,175,000 | $700,000 | $475,000 |
Source: Public Records
Map
Nearby Homes
- 357 Cadbrook Dr
- 14940 Beckner St
- 14612 Hutchcroft St
- 544 N Orange Ave Unit B
- 320 S 5th Ave
- 750 Glenshaw Dr
- 433 Sunkist Ave
- 15149 Salt Lake Ave
- 15246 Temple Ave
- 14972 Giordano St
- 736 Tonopah Ave
- 421 S 5th Ave
- 829 Foxworth Ave
- 14421 Flynn St
- 335 Willow Ave
- 452 Willow Ave
- 227 S 4th Ave
- 338 S 4th Ave
- 14510 Amar Rd Unit J
- 13903 Moccasin St
- 14730 Valley Blvd
- 127 S 8th Ave
- 137 S 8th Ave
- 127 S 8th Ave Unit D
- 145 S 8th Ave
- 14662 Valley Blvd
- 130 S 8th Ave
- 14664 Valley Blvd
- 136 S 8th Ave
- 14650 Valley Blvd
- 203 S 8th Ave
- 14642 Valley Blvd
- 14668 Valley Blvd
- 209 S 8th Ave
- 14636 Valley Blvd
- 213 S 8th Ave
- 14834 Valley Blvd
- 219 S 8th Ave
- 212 S 8th Ave
- 162 S 8th Ave