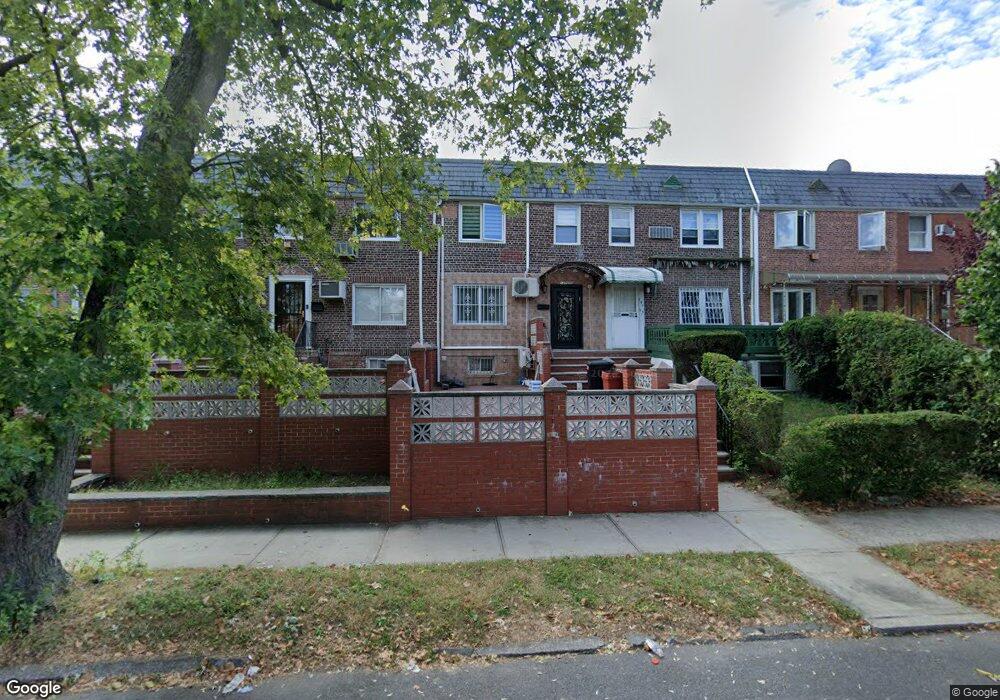
14738 77th Ave Flushing, NY 11367
Kew Gardens Hills NeighborhoodEstimated Value: $914,166 - $1,066,000
Studio
--
Bath
1,530
Sq Ft
$640/Sq Ft
Est. Value
About This Home
This home is located at 14738 77th Ave, Flushing, NY 11367 and is currently estimated at $979,792, approximately $640 per square foot. 14738 77th Ave is a home located in Queens County with nearby schools including P.S. 154, I.S. 250 - The Robert F. Kennedy Community Middle School, and Solomon Schechter School of Queens.
Ownership History
Date
Name
Owned For
Owner Type
Purchase Details
Closed on
Oct 10, 2017
Sold by
The Dora Yunatanova Personal Residence T
Bought by
Abramchayeva Anzhela and Khanimov Eduard
Current Estimated Value
Home Financials for this Owner
Home Financials are based on the most recent Mortgage that was taken out on this home.
Original Mortgage
$623,000
Outstanding Balance
$519,821
Interest Rate
3.78%
Mortgage Type
Purchase Money Mortgage
Estimated Equity
$459,971
Purchase Details
Closed on
Jan 8, 2013
Sold by
Yunatanov Roshily
Bought by
Solomon Yunatanov As Trustee and The Roshily Yunatanov Personal Residence
Purchase Details
Closed on
Oct 31, 1997
Sold by
Meinking Audrey
Bought by
Yunatanov Roshily and Yunatanova Dora
Home Financials for this Owner
Home Financials are based on the most recent Mortgage that was taken out on this home.
Original Mortgage
$123,600
Interest Rate
7.31%
Create a Home Valuation Report for This Property
The Home Valuation Report is an in-depth analysis detailing your home's value as well as a comparison with similar homes in the area
Home Values in the Area
Average Home Value in this Area
Purchase History
| Date | Buyer | Sale Price | Title Company |
|---|---|---|---|
| Abramchayeva Anzhela | $865,000 | -- | |
| Solomon Yunatanov As Trustee | -- | -- | |
| Solomon Yunatanov As Trustee | -- | -- | |
| Yunatanov Roshily | -- | -- | |
| Yunatanov Roshily | $206,000 | First American Title Ins Co |
Source: Public Records
Mortgage History
| Date | Status | Borrower | Loan Amount |
|---|---|---|---|
| Open | Abramchayeva Anzhela | $623,000 | |
| Previous Owner | Yunatanov Roshily | $123,600 |
Source: Public Records
Tax History
| Year | Tax Paid | Tax Assessment Tax Assessment Total Assessment is a certain percentage of the fair market value that is determined by local assessors to be the total taxable value of land and additions on the property. | Land | Improvement |
|---|---|---|---|---|
| 2025 | $7,204 | $38,020 | $11,104 | $26,916 |
| 2024 | $7,204 | $35,868 | $11,246 | $24,622 |
| 2023 | $6,797 | $33,840 | $10,707 | $23,133 |
| 2022 | $6,755 | $48,420 | $14,580 | $33,840 |
| 2021 | $7,068 | $51,780 | $14,580 | $37,200 |
| 2020 | $6,706 | $53,400 | $14,580 | $38,820 |
| 2019 | $6,253 | $48,060 | $14,580 | $33,480 |
| 2018 | $5,749 | $28,200 | $9,531 | $18,669 |
| 2017 | $4,012 | $28,200 | $10,289 | $17,911 |
| 2016 | $2,487 | $28,200 | $10,289 | $17,911 |
| 2015 | $2,989 | $26,403 | $13,153 | $13,250 |
| 2014 | $2,989 | $24,909 | $13,587 | $11,322 |
Source: Public Records
Map
Nearby Homes
- 150-20 77th Ave
- 150-22 77th Ave
- 150-25 77th Rd
- 144-11 77th Rd Unit A
- 144-41 76th Ave
- 78-16 147th St Unit 3C
- 77-43 Main St
- 144-32 78th Ave Unit 1G
- 150-43 77th Rd
- 150 E 78th St Unit DPH 11B
- 144-22 78th Ave Unit 3FL
- 78-35 147th St Unit 2E
- 150-02 78th Rd
- 15062 77th Ave
- 144-19 78th Rd Unit 3E
- 144-15 78th Rd Unit 2D
- 144-30 78th Rd Unit 3F
- 144-30 78th Rd Unit 3G
- 147-11 79th Ave Unit 3L
- 144-20 78th Rd Unit 3
Your Personal Tour Guide
Ask me questions while you tour the home.