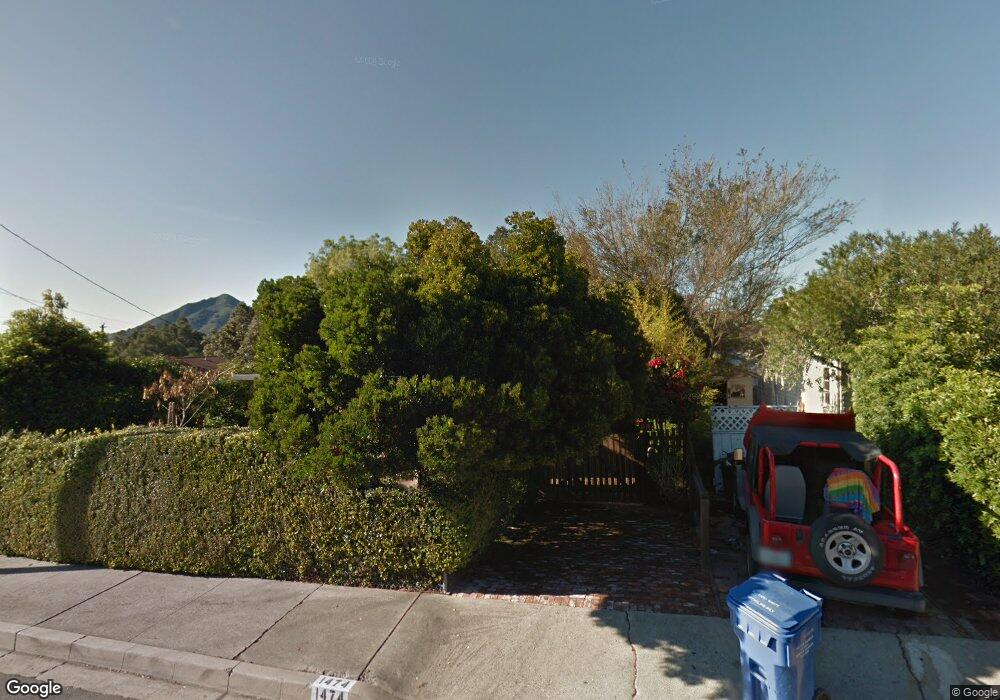
1474 Iris St San Luis Obispo, CA 93401
Woodland Drive NeighborhoodEstimated Value: $829,945 - $1,305,000
2
Beds
2
Baths
1,146
Sq Ft
$954/Sq Ft
Est. Value
About This Home
This home is located at 1474 Iris St, San Luis Obispo, CA 93401 and is currently estimated at $1,093,236, approximately $953 per square foot. 1474 Iris St is a home located in San Luis Obispo County with nearby schools including Bishop's Peak Elementary School, Laguna Middle School, and San Luis Obispo High School.
Ownership History
Date
Name
Owned For
Owner Type
Purchase Details
Closed on
Apr 21, 2017
Sold by
Kahn Edith M
Bought by
Kahn Edith
Current Estimated Value
Purchase Details
Closed on
Mar 3, 1999
Sold by
Vaneps John
Bought by
Kahn Edith M
Home Financials for this Owner
Home Financials are based on the most recent Mortgage that was taken out on this home.
Original Mortgage
$174,605
Outstanding Balance
$29,154
Interest Rate
2.95%
Estimated Equity
$1,064,082
Purchase Details
Closed on
Nov 30, 1998
Sold by
Vaneps Jacque
Bought by
Vaneps John
Purchase Details
Closed on
Apr 1, 1998
Sold by
Graham Peter Mann and Graham Kitson Crowell
Bought by
Vaneps John and Vaneps Jacque
Home Financials for this Owner
Home Financials are based on the most recent Mortgage that was taken out on this home.
Original Mortgage
$151,600
Interest Rate
7.37%
Mortgage Type
Stand Alone Second
Create a Home Valuation Report for This Property
The Home Valuation Report is an in-depth analysis detailing your home's value as well as a comparison with similar homes in the area
Home Values in the Area
Average Home Value in this Area
Purchase History
| Date | Buyer | Sale Price | Title Company |
|---|---|---|---|
| Kahn Edith | -- | None Available | |
| Kahn Edith M | $218,500 | Cuesta Title Company | |
| Vaneps John | -- | -- | |
| Vaneps John | $189,500 | Cuesta Title |
Source: Public Records
Mortgage History
| Date | Status | Borrower | Loan Amount |
|---|---|---|---|
| Open | Kahn Edith M | $174,605 | |
| Previous Owner | Vaneps John | $151,600 | |
| Closed | Vaneps John | $28,425 |
Source: Public Records
Tax History Compared to Growth
Tax History
| Year | Tax Paid | Tax Assessment Tax Assessment Total Assessment is a certain percentage of the fair market value that is determined by local assessors to be the total taxable value of land and additions on the property. | Land | Improvement |
|---|---|---|---|---|
| 2025 | $3,630 | $342,139 | $188,115 | $154,024 |
| 2024 | $3,563 | $335,431 | $184,427 | $151,004 |
| 2023 | $3,563 | $328,855 | $180,811 | $148,044 |
| 2022 | $3,338 | $322,408 | $177,266 | $145,142 |
| 2021 | $3,283 | $316,088 | $173,791 | $142,297 |
| 2020 | $3,249 | $312,847 | $172,009 | $140,838 |
| 2019 | $3,214 | $306,714 | $168,637 | $138,077 |
| 2018 | $3,149 | $300,701 | $165,331 | $135,370 |
| 2017 | $3,086 | $294,806 | $162,090 | $132,716 |
| 2016 | $3,024 | $289,026 | $158,912 | $130,114 |
| 2015 | $2,977 | $284,685 | $156,525 | $128,160 |
| 2014 | $2,732 | $279,109 | $153,459 | $125,650 |
Source: Public Records
Map
Nearby Homes
- 1443 Iris St
- 1771 Johnson Ave
- 1697 Fixlini St
- 2052 Johnson Ave
- 2085 Fixlini St
- 1263 Pismo St
- 1075 Ella St Unit 3
- 1010 Church St
- 1700 Osos St
- 1079 Pauline Way
- 2406 Johnson Ave
- 1437 Smith St
- 880 Buchon St
- 1328 Morro St Unit 130
- 1304 Sydney St
- 2375 Boulevard Del Campo
- 1308 Monterey St Unit 340
- 1536 Garden St
- 2516 Greta Place
- 2606 El Cerrito St
- 1460 Iris St
- 1875 Fixlini St
- 1867 Fixlini St
- 1850 Johnson Ave Unit 6
- 1850 Johnson Ave
- 1840 Johnson Ave
- 1441 Iris St
- 1469 Lizzie St
- 1439 Iris St
- 1890 Fixlini St
- 1831 Fixlini St
- 1876 Fixlini St
- 1453 Lizzie St
- 1491 Iris St
- 1838 Johnson Ave
- 1862 Fixlini St
- 1852 Fixlini St
- 1916 Johnson Ave
- 1828 Johnson Ave
- 1920 Fixlini St