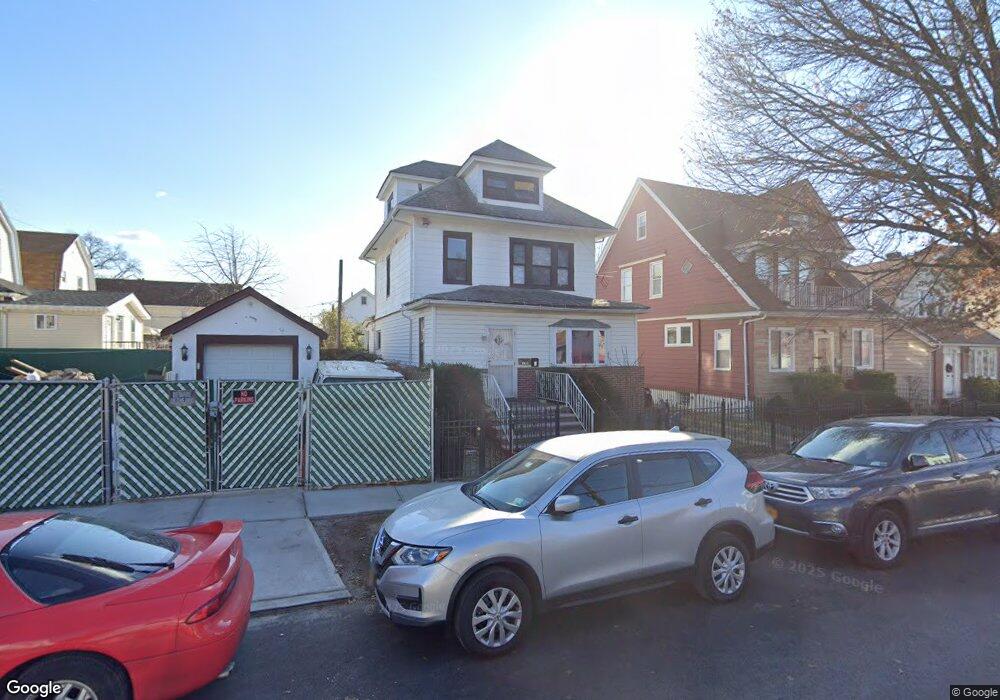
14748 Elm Ave Flushing, NY 11355
East Flushing NeighborhoodEstimated Value: $1,358,000 - $1,774,000
Studio
--
Bath
2,367
Sq Ft
$649/Sq Ft
Est. Value
About This Home
This home is located at 14748 Elm Ave, Flushing, NY 11355 and is currently estimated at $1,537,297, approximately $649 per square foot. 14748 Elm Ave is a home located in Queens County with nearby schools including P.S. 22 - Thomas Jefferson, J.H.S. 189Q Daniel Carter Beard, and Francis Lewis High School.
Ownership History
Date
Name
Owned For
Owner Type
Purchase Details
Closed on
Apr 23, 2009
Sold by
Mei Alan Zibo and Mei Dan Tong
Bought by
Huang Gang Wen
Current Estimated Value
Home Financials for this Owner
Home Financials are based on the most recent Mortgage that was taken out on this home.
Original Mortgage
$499,000
Interest Rate
4.9%
Mortgage Type
Purchase Money Mortgage
Purchase Details
Closed on
Mar 28, 2006
Sold by
Liu Kyung Sook
Bought by
Mei Alan Zibo and Mei Dan Tong
Home Financials for this Owner
Home Financials are based on the most recent Mortgage that was taken out on this home.
Original Mortgage
$460,000
Interest Rate
6.28%
Mortgage Type
Purchase Money Mortgage
Purchase Details
Closed on
Nov 13, 2000
Sold by
Liu Tung Teh
Bought by
Liu Kyung Sook
Purchase Details
Closed on
Sep 29, 1999
Sold by
Yen Chin Min
Bought by
Liu Tung Teh
Purchase Details
Closed on
Dec 8, 1998
Sold by
Liu Tung Teh and Liu Kyung Sook
Bought by
Yen Chin Min
Create a Home Valuation Report for This Property
The Home Valuation Report is an in-depth analysis detailing your home's value as well as a comparison with similar homes in the area
Home Values in the Area
Average Home Value in this Area
Purchase History
| Date | Buyer | Sale Price | Title Company |
|---|---|---|---|
| Huang Gang Wen | $720,000 | -- | |
| Huang Gang Wen | $720,000 | -- | |
| Mei Alan Zibo | $675,000 | -- | |
| Mei Alan Zibo | $675,000 | -- | |
| Liu Kyung Sook | -- | -- | |
| Liu Kyung Sook | -- | -- | |
| Liu Tung Teh | -- | -- | |
| Liu Tung Teh | -- | -- | |
| Yen Chin Min | $202,000 | -- | |
| Yen Chin Min | $202,000 | -- |
Source: Public Records
Mortgage History
| Date | Status | Borrower | Loan Amount |
|---|---|---|---|
| Previous Owner | Huang Gang Wen | $499,000 | |
| Previous Owner | Mei Alan Zibo | $460,000 |
Source: Public Records
Tax History
| Year | Tax Paid | Tax Assessment Tax Assessment Total Assessment is a certain percentage of the fair market value that is determined by local assessors to be the total taxable value of land and additions on the property. | Land | Improvement |
|---|---|---|---|---|
| 2025 | $10,718 | $56,566 | $11,214 | $45,352 |
| 2024 | $10,718 | $53,364 | $11,539 | $41,825 |
| 2023 | $10,718 | $53,364 | $12,777 | $40,587 |
| 2022 | $10,653 | $66,180 | $19,020 | $47,160 |
| 2021 | $11,179 | $54,840 | $19,020 | $35,820 |
| 2020 | $10,607 | $53,220 | $19,020 | $34,200 |
| 2019 | $4,857 | $23,220 | $19,020 | $4,200 |
| 2018 | $7,301 | $35,814 | $12,367 | $23,447 |
| 2017 | $7,301 | $35,814 | $11,913 | $23,901 |
| 2016 | $7,105 | $35,814 | $11,913 | $23,901 |
| 2015 | $3,855 | $33,531 | $14,359 | $19,172 |
| 2014 | $3,855 | $31,634 | $14,807 | $16,827 |
Source: Public Records
Map
Nearby Homes
- 149-27 45th Ave
- 4307 149th St
- 45-24 Burling St
- 148-11 Kalmia Ave
- 148-10 Kalmia Ave
- 149-36 Ash Ave
- 148-24 Kalmia Ave
- 45-30 Smart St
- 42-26 147th St Unit 5B
- 43-23 156th St
- 146-23 Laburnum Ave
- 143-16 Holly Ave
- 148-29 Laburnum Ave
- 45-19 158th St
- 149-63 Ash Ave
- 146-18 Laburnum Ave
- 46-05 158th St
- 46-43 157th St
- 154-21 Ash Ave
- 14917 Sanford Ave Unit 4A
- 147-48 Elm Ave Unit 1 Fl
- 147-48 Elm Ave
- 14742 Elm Ave
- 14742 Elm Ave
- 4358 149th St
- 14738 Elm Ave
- 4354 149th St
- 4362 149th St
- 14738 Elm Ave
- 43-58 149th St
- 4358 149th St Unit 2
- 43-58 149th St Unit 2
- 43-62 149th St
- 4364 149th St
- 14745 45th Ave
- 14743 45th Ave
- 14741 45th Ave
- 147-45 45th Ave Unit 1
- 14736 Elm Ave
- 14739 45th Ave
Your Personal Tour Guide
Ask me questions while you tour the home.