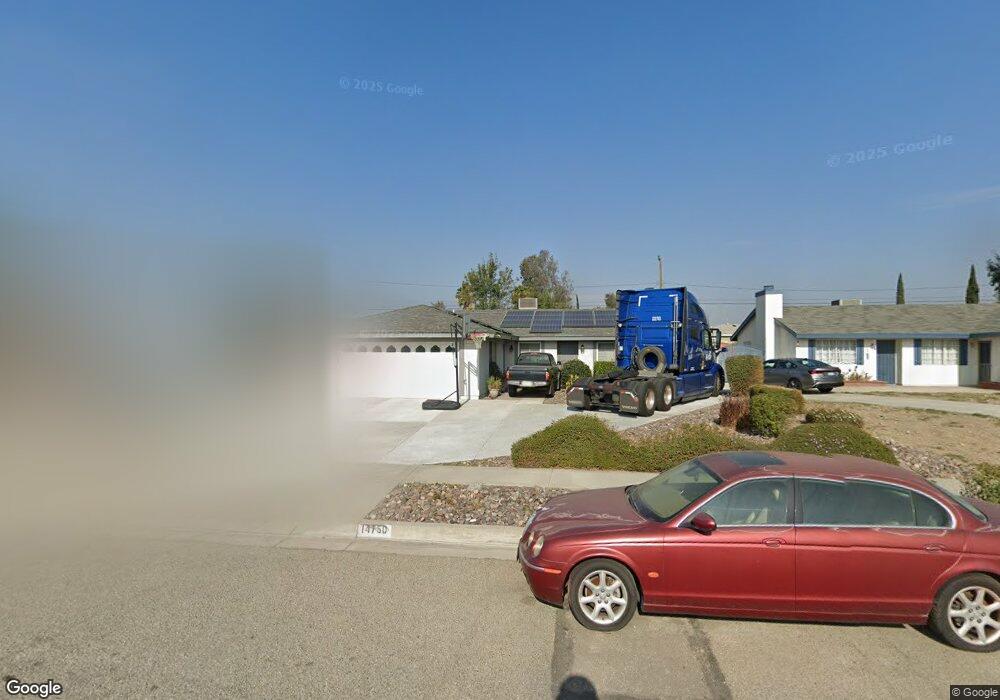
14750 Mallory Dr Fontana, CA 92335
Estimated Value: $525,000 - $577,000
3
Beds
2
Baths
1,098
Sq Ft
$508/Sq Ft
Est. Value
About This Home
This home is located at 14750 Mallory Dr, Fontana, CA 92335 and is currently estimated at $557,362, approximately $507 per square foot. 14750 Mallory Dr is a home located in San Bernardino County with nearby schools including Poplar Elementary School, Sequoia Middle School, and Henry J. Kaiser High School.
Ownership History
Date
Name
Owned For
Owner Type
Purchase Details
Closed on
Dec 29, 2015
Sold by
Peltier Gregory Malcolm
Bought by
Peltier Gregory Malcolm and Peltier Sarah
Current Estimated Value
Purchase Details
Closed on
Apr 30, 2013
Sold by
Continental Hl-023 Trust
Bought by
Gregory Malcolm Peltier Trust
Purchase Details
Closed on
Jun 4, 2011
Sold by
Peltier Gregory M and Peltier Sarah
Bought by
Continental Hl-023 Trust
Purchase Details
Closed on
Jul 18, 2008
Sold by
Peltier Gregory M and Peltier Gregoy M
Bought by
Peltier Gregory M and Peltier Sarah
Home Financials for this Owner
Home Financials are based on the most recent Mortgage that was taken out on this home.
Original Mortgage
$265,828
Interest Rate
6.31%
Mortgage Type
New Conventional
Create a Home Valuation Report for This Property
The Home Valuation Report is an in-depth analysis detailing your home's value as well as a comparison with similar homes in the area
Home Values in the Area
Average Home Value in this Area
Purchase History
| Date | Buyer | Sale Price | Title Company |
|---|---|---|---|
| Peltier Gregory Malcolm | -- | None Available | |
| Gregory Malcolm Peltier Trust | -- | None Available | |
| Continental Hl-023 Trust | -- | None Available | |
| Peltier Gregory M | -- | Chicago Title | |
| Peltier Gregory M | -- | Chicago Title Co |
Source: Public Records
Mortgage History
| Date | Status | Borrower | Loan Amount |
|---|---|---|---|
| Previous Owner | Peltier Gregory M | $265,828 |
Source: Public Records
Tax History Compared to Growth
Tax History
| Year | Tax Paid | Tax Assessment Tax Assessment Total Assessment is a certain percentage of the fair market value that is determined by local assessors to be the total taxable value of land and additions on the property. | Land | Improvement |
|---|---|---|---|---|
| 2025 | $3,032 | $298,317 | $111,277 | $187,040 |
| 2024 | $3,032 | $292,468 | $109,095 | $183,373 |
| 2023 | $2,953 | $286,733 | $106,956 | $179,777 |
| 2022 | $2,939 | $281,111 | $104,859 | $176,252 |
| 2021 | $2,901 | $275,599 | $102,803 | $172,796 |
| 2020 | $2,893 | $272,773 | $101,749 | $171,024 |
| 2019 | $2,804 | $267,425 | $99,754 | $167,671 |
| 2018 | $2,845 | $262,181 | $97,798 | $164,383 |
| 2017 | $2,828 | $257,040 | $95,880 | $161,160 |
| 2016 | $2,779 | $252,000 | $94,000 | $158,000 |
| 2015 | $2,321 | $203,897 | $61,476 | $142,421 |
| 2014 | $2,318 | $199,903 | $60,272 | $139,631 |
Source: Public Records
Map
Nearby Homes
- 14582 El Molino St
- 17377 20 Valley Blvd
- 9828 Carob Ave
- 15162 Cambria St
- 9326 Bunny Ln
- 10238 Cherry Ave
- 15240 Carob Ln
- 9310 Carob St
- 9756 Elm Ave
- 15278 Boyle Ave
- 14989 Hibiscus Ave
- 15065 Granada Ct
- 9963 Eugenia Ave
- 15317 Athol St
- 9059 Beech Ave
- 15082 Valley Blvd
- 9408 Poplar Ave
- 14770 Boyle Ave
- 10566 Calabash Ave
- 15798 Slover Ave
- 14738 Mallory Dr
- 14762 Mallory Dr
- 14774 Mallory Dr
- 14726 Mallory Dr
- 14745 El Molino St
- 14735 El Molino St
- 14755 El Molino St
- 14725 El Molino St
- 14714 Mallory Dr
- 14786 Mallory Dr
- 14765 El Molino St
- 14749 Mallory Dr
- 14755 Mallory Dr
- 14737 Mallory Dr
- 14715 El Molino St
- 14761 Mallory Dr
- 14725 Mallory Dr
- 14775 El Molino St
- 14790 Mallory Dr
- 9855 Redwood Ave