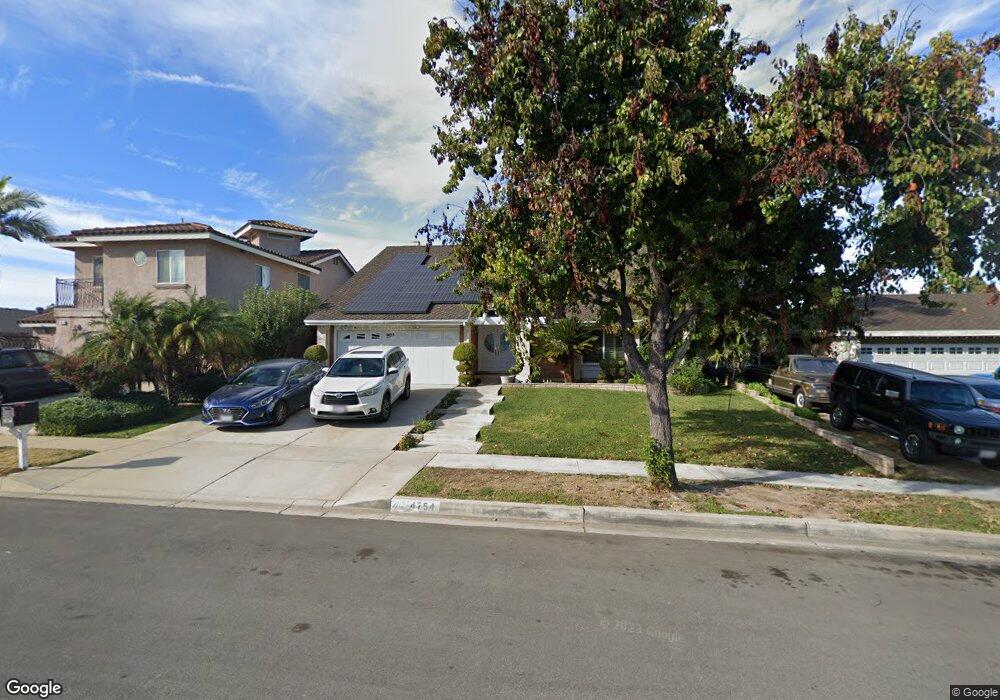
14754 Velvet St Chino Hills, CA 91709
North Chino Hills NeighborhoodEstimated Value: $931,000 - $1,050,464
4
Beds
3
Baths
2,061
Sq Ft
$484/Sq Ft
Est. Value
About This Home
This home is located at 14754 Velvet St, Chino Hills, CA 91709 and is currently estimated at $996,866, approximately $483 per square foot. 14754 Velvet St is a home located in San Bernardino County with nearby schools including Gerald F. Litel Elementary School, Canyon Hills Junior High School, and Ruben S. Ayala High School.
Ownership History
Date
Name
Owned For
Owner Type
Purchase Details
Closed on
Dec 6, 2012
Sold by
Ru Hao
Bought by
Fan Ru Hao and Fan Xia An
Current Estimated Value
Home Financials for this Owner
Home Financials are based on the most recent Mortgage that was taken out on this home.
Original Mortgage
$315,000
Outstanding Balance
$218,244
Interest Rate
3.37%
Mortgage Type
New Conventional
Estimated Equity
$778,622
Purchase Details
Closed on
Jan 27, 2010
Sold by
Myers Gordon and Myers Kathy J
Bought by
Fan Ru Hao and Fan Xia An
Home Financials for this Owner
Home Financials are based on the most recent Mortgage that was taken out on this home.
Original Mortgage
$326,000
Interest Rate
4.94%
Mortgage Type
New Conventional
Purchase Details
Closed on
Oct 29, 2004
Sold by
Myers Kathy J and Quattrocchi Kathy
Bought by
Myers Gordon and Myers Kathy J
Home Financials for this Owner
Home Financials are based on the most recent Mortgage that was taken out on this home.
Original Mortgage
$333,700
Interest Rate
5.69%
Mortgage Type
New Conventional
Create a Home Valuation Report for This Property
The Home Valuation Report is an in-depth analysis detailing your home's value as well as a comparison with similar homes in the area
Home Values in the Area
Average Home Value in this Area
Purchase History
| Date | Buyer | Sale Price | Title Company |
|---|---|---|---|
| Fan Ru Hao | -- | Accommodation | |
| Ru Hao | -- | Fidelity Title | |
| Fan Ru Hao | $410,000 | Chicago Title Company | |
| Myers Gordon | -- | Atc-Glendale |
Source: Public Records
Mortgage History
| Date | Status | Borrower | Loan Amount |
|---|---|---|---|
| Open | Ru Hao | $315,000 | |
| Previous Owner | Fan Ru Hao | $326,000 | |
| Previous Owner | Myers Gordon | $333,700 |
Source: Public Records
Tax History Compared to Growth
Tax History
| Year | Tax Paid | Tax Assessment Tax Assessment Total Assessment is a certain percentage of the fair market value that is determined by local assessors to be the total taxable value of land and additions on the property. | Land | Improvement |
|---|---|---|---|---|
| 2025 | $5,678 | $529,240 | $185,234 | $344,006 |
| 2024 | $5,678 | $518,863 | $181,602 | $337,261 |
| 2023 | $5,520 | $508,689 | $178,041 | $330,648 |
| 2022 | $5,486 | $498,715 | $174,550 | $324,165 |
| 2021 | $5,378 | $488,936 | $171,127 | $317,809 |
| 2020 | $5,308 | $483,922 | $169,372 | $314,550 |
| 2019 | $5,214 | $474,433 | $166,051 | $308,382 |
| 2018 | $5,098 | $465,130 | $162,795 | $302,335 |
| 2017 | $5,005 | $456,010 | $159,603 | $296,407 |
| 2016 | $4,676 | $447,069 | $156,474 | $290,595 |
| 2015 | $4,582 | $440,354 | $154,124 | $286,230 |
| 2014 | $4,490 | $431,728 | $151,105 | $280,623 |
Source: Public Records
Map
Nearby Homes
- 3546 Garden Ct
- 3372 Buckingham Rd
- 3199 Morningfield Dr
- 3567 Terrace Dr
- 3473 Terrace Dr
- 3167 Morningfield Dr
- 3159 Morningfield Dr
- 3786 Daisy Dr
- 3695 Terrace Dr
- 14797 Maplewood Dr
- 3964 Alder Place
- 3692 Glen Ridge Dr
- 2891 Galloping Hills Rd
- 14969 Redwood Ln
- 15358 Morningside Dr
- 15413 Oakgrove Ct
- 15335 Rolling Ridge Dr
- 3107 Morningside Dr
- 2702 Avenida Marguerite
- 3027 Spyglass Ct
- 14764 Velvet St
- 14744 Velvet St
- 14755 Acorn St
- 14774 Velvet St
- 14734 Velvet St
- 14763 Acorn St
- 14745 Acorn St
- 14735 Acorn St
- 14771 Acorn St
- 14755 Velvet St
- 14765 Velvet St
- 14745 Velvet St
- 14784 Velvet St
- 14724 Velvet St
- 14775 Velvet St
- 14735 Velvet St
- 14725 Acorn St
- 14781 Acorn St
- 14794 Velvet St
- 14785 Velvet St