
Landlord's Agent in 2016
Nicole Plante
Even Keel Realty, Inc.
(508) 265-3795
10 in this area
102 Total Sales
Estimated Value: $796,000 - $1,110,000
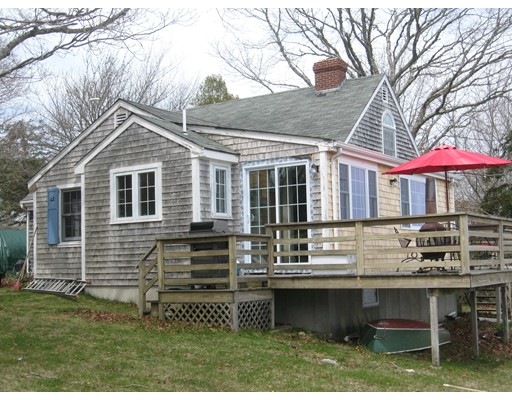
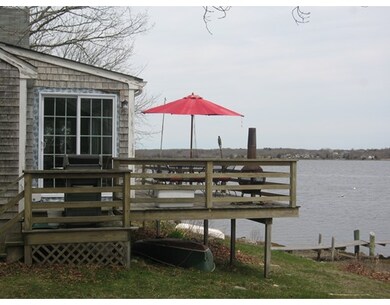
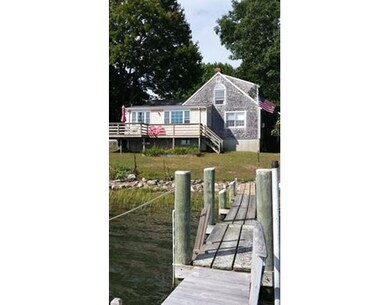
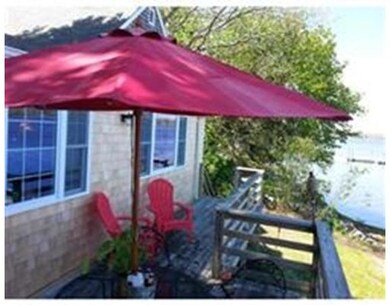
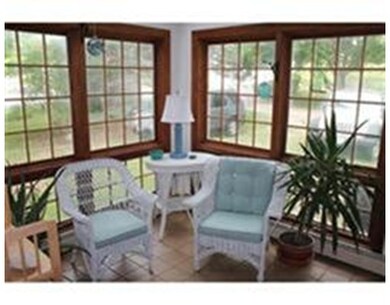
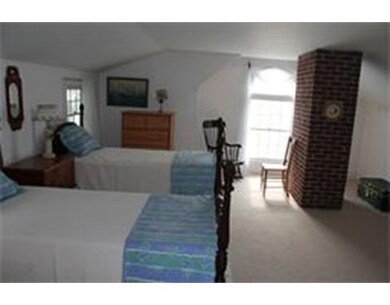
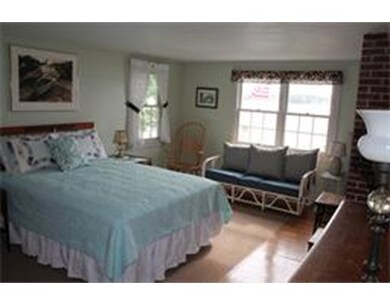
Natural light streams through the multiple skylights & windows of the comtemporary which provides expansive views of the east branch of the Westport River. Interesting angles, cathedral ceilings, and flowing open space make this a unique home.
Home Type
Other
Year Built
1987
Lot Details
0
| Date | Buyer | Sale Price | Title Company |
|---|---|---|---|
| Rossiter Ft | -- | -- | |
| Rossiter Ft | -- | -- |
| Date | Event | Price | List to Sale | Price per Sq Ft | Prior Sale |
|---|---|---|---|---|---|
| 11/24/2025 11/24/25 | Off Market | $445,000 | -- | -- | |
| 12/12/2016 12/12/16 | Rented | $1,500 | -25.0% | -- | |
| 11/30/2016 11/30/16 | Under Contract | -- | -- | -- | |
| 08/25/2016 08/25/16 | Rented | $2,000 | +17.6% | -- | |
| 08/18/2016 08/18/16 | Under Contract | -- | -- | -- | |
| 08/18/2016 08/18/16 | For Rent | $1,700 | -15.0% | -- | |
| 01/19/2016 01/19/16 | For Rent | $2,000 | +33.3% | -- | |
| 10/01/2015 10/01/15 | Rented | $1,500 | -16.7% | -- | |
| 09/19/2015 09/19/15 | Under Contract | -- | -- | -- | |
| 09/07/2015 09/07/15 | Price Changed | $1,800 | -10.0% | $1 / Sq Ft | |
| 08/20/2015 08/20/15 | For Rent | $2,000 | 0.0% | -- | |
| 10/29/2013 10/29/13 | Sold | $445,000 | -10.1% | $193 / Sq Ft | View Prior Sale |
| 09/29/2013 09/29/13 | Pending | -- | -- | -- | |
| 04/10/2013 04/10/13 | For Sale | $495,000 | -- | $215 / Sq Ft |
| Year | Tax Paid | Tax Assessment Tax Assessment Total Assessment is a certain percentage of the fair market value that is determined by local assessors to be the total taxable value of land and additions on the property. | Land | Improvement |
|---|---|---|---|---|
| 2025 | $7,286 | $978,000 | $795,800 | $182,200 |
| 2024 | $6,517 | $843,100 | $699,200 | $143,900 |
| 2023 | $6,545 | $802,100 | $665,900 | $136,200 |
| 2022 | $5,497 | $782,700 | $665,900 | $116,800 |
| 2021 | $5,497 | $637,700 | $522,800 | $114,900 |
| 2020 | $5,200 | $616,800 | $501,900 | $114,900 |
| 2019 | $5,656 | $683,900 | $570,500 | $113,400 |
| 2018 | $4,459 | $545,800 | $473,300 | $72,500 |
| 2017 | $4,416 | $554,100 | $473,300 | $80,800 |
| 2016 | $4,368 | $552,200 | $473,300 | $78,900 |
| 2015 | $4,346 | $548,000 | $473,300 | $74,700 |
Landlord's Agent in 2016
Nicole Plante
Even Keel Realty, Inc.
(508) 265-3795
10 in this area
102 Total Sales
K
Seller's Agent in 2013
Kathy Santos
Residential Properties Ltd.
(508) 889-2517
17 in this area
42 Total Sales
N
Seller Co-Listing Agent in 2013
Non-Mls Member
Non-Mls Member
Source: MLS Property Information Network (MLS PIN)
MLS Number: 72055221
APN: WPOR-000056A-000000-000048
Disclaimer: Certain information contained herein is derived from information provided by parties other than Homes.com. All information provided is deemed reliable, but is not guaranteed to be accurate and should be independently verified.
![]() The property listing data and information, or the Images, set forth herein were provided to MLS Property Information Network, Inc. from third party sources, including sellers, lessors and public records, and were compiled by MLS Property Information Network, Inc. The property listing data and information, and the Images, are for the personal, non-commercial use of consumers having a good faith interest in purchasing or leasing listed properties of the type displayed to them and may not be used for any purpose other than to identify prospective properties which such consumers may have a good faith interest in purchasing or leasing. MLS Property Information Network, Inc. and its subscribers disclaim any and all representations and warranties as to the accuracy of the property listing data and information, or as to the accuracy of any of the Images, set forth herein.
The property listing data and information, or the Images, set forth herein were provided to MLS Property Information Network, Inc. from third party sources, including sellers, lessors and public records, and were compiled by MLS Property Information Network, Inc. The property listing data and information, and the Images, are for the personal, non-commercial use of consumers having a good faith interest in purchasing or leasing listed properties of the type displayed to them and may not be used for any purpose other than to identify prospective properties which such consumers may have a good faith interest in purchasing or leasing. MLS Property Information Network, Inc. and its subscribers disclaim any and all representations and warranties as to the accuracy of the property listing data and information, or as to the accuracy of any of the Images, set forth herein.