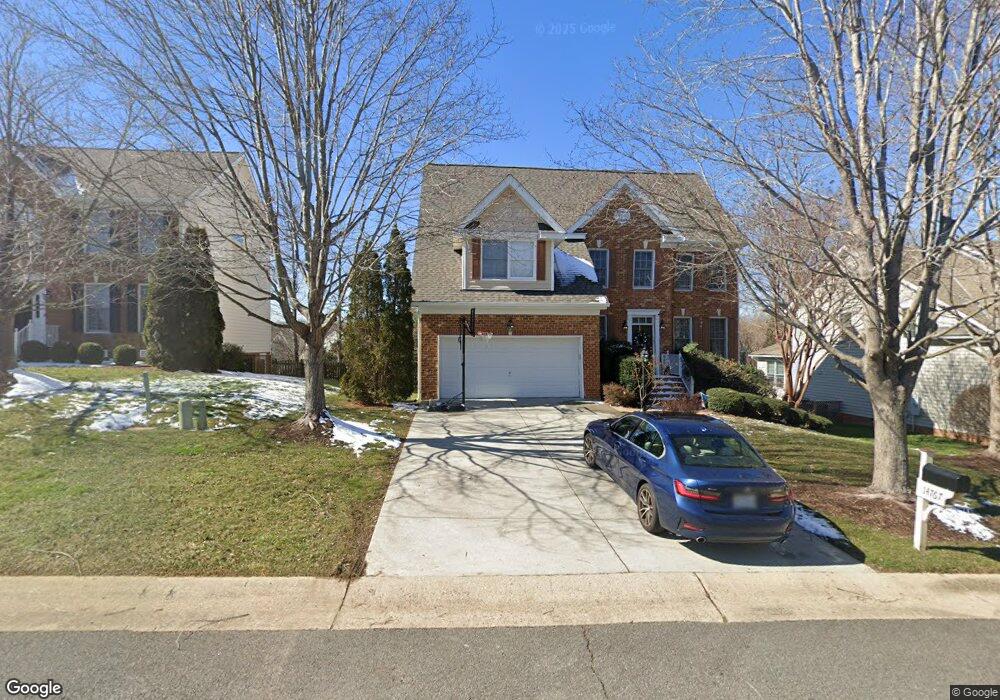
14767 Rolling Spring Dr Midlothian, VA 23114
Estimated Value: $575,934 - $664,000
4
Beds
4
Baths
2,980
Sq Ft
$209/Sq Ft
Est. Value
About This Home
This home is located at 14767 Rolling Spring Dr, Midlothian, VA 23114 and is currently estimated at $621,984, approximately $208 per square foot. 14767 Rolling Spring Dr is a home located in Chesterfield County with nearby schools including Evergreen Elementary, Tomahawk Creek Middle School, and Midlothian High School.
Ownership History
Date
Name
Owned For
Owner Type
Purchase Details
Closed on
Feb 15, 2017
Sold by
Damevski Kostadin B and Vedian Abba
Bought by
Damevski Kostadin B and Vedina Anna
Current Estimated Value
Purchase Details
Closed on
Apr 20, 2010
Sold by
Pratt Sandra L
Bought by
Damevski Kostadin B
Home Financials for this Owner
Home Financials are based on the most recent Mortgage that was taken out on this home.
Original Mortgage
$318,681
Outstanding Balance
$214,865
Interest Rate
5.25%
Mortgage Type
FHA
Estimated Equity
$407,119
Purchase Details
Closed on
Mar 14, 2006
Sold by
Parker and Orleans Homebu
Bought by
Pratt Jerry
Home Financials for this Owner
Home Financials are based on the most recent Mortgage that was taken out on this home.
Original Mortgage
$309,400
Interest Rate
6.27%
Mortgage Type
New Conventional
Create a Home Valuation Report for This Property
The Home Valuation Report is an in-depth analysis detailing your home's value as well as a comparison with similar homes in the area
Home Values in the Area
Average Home Value in this Area
Purchase History
| Date | Buyer | Sale Price | Title Company |
|---|---|---|---|
| Damevski Kostadin B | -- | None Available | |
| Damevski Kostadin B | $330,000 | -- | |
| Pratt Jerry | $409,400 | -- |
Source: Public Records
Mortgage History
| Date | Status | Borrower | Loan Amount |
|---|---|---|---|
| Open | Damevski Kostadin B | $318,681 | |
| Previous Owner | Pratt Jerry | $309,400 |
Source: Public Records
Tax History
| Year | Tax Paid | Tax Assessment Tax Assessment Total Assessment is a certain percentage of the fair market value that is determined by local assessors to be the total taxable value of land and additions on the property. | Land | Improvement |
|---|---|---|---|---|
| 2025 | $4,425 | $494,400 | $96,000 | $398,400 |
| 2024 | $4,425 | $468,900 | $96,000 | $372,900 |
| 2023 | $4,041 | $444,100 | $96,000 | $348,100 |
| 2022 | $3,654 | $397,200 | $93,000 | $304,200 |
| 2021 | $3,327 | $347,600 | $91,000 | $256,600 |
| 2020 | $3,302 | $347,600 | $91,000 | $256,600 |
| 2019 | $3,179 | $334,600 | $90,000 | $244,600 |
| 2018 | $3,302 | $347,600 | $90,000 | $257,600 |
| 2017 | $3,228 | $336,200 | $85,000 | $251,200 |
| 2016 | $3,087 | $321,600 | $85,000 | $236,600 |
| 2015 | $3,234 | $335,600 | $85,000 | $250,600 |
| 2014 | $3,162 | $326,800 | $78,000 | $248,800 |
Source: Public Records
Map
Nearby Homes
- 1518 Lundy Terrace
- 14225 Camack Trail
- 14207 Jeffries Place
- 1118 Bach Ln
- 1012 Water Beech Rd
- 1306 Bach Terrace
- 1101 Arborway Ln
- 1119 Ashton Village Ln
- 734 Bristol Village Dr Unit 202
- 734 Bristol Village Dr Unit 208
- 1066 Arbor Heights Terrace
- 14118 Beaver Brook Dr
- 14106 Beaver Brook Dr Unit 14106
- 14010 Briars Cir Unit 404
- 1079 Arbor Heights Terrace
- 14007 Millpointe Rd Unit 16C
- 1042 Arbor Heights Terrace
- 910 Westwood Village Way Unit 402
- 1020 Westwood Village Way Unit 403
- 704 Bristol Village Dr Unit 301
- 14761 Rolling Spring Dr
- 14773 Rolling Spring Dr
- 1430 Lundy Terrace
- 14755 Rolling Spring Dr
- 14779 Rolling Spring Dr
- 1436 Lundy Terrace
- 1424 Lundy Terrace
- 14766 Rolling Spring Dr
- 14760 Rolling Spring Dr
- 14772 Rolling Spring Dr
- 1418 Lundy Terrace
- 1442 Lundy Terrace
- 14754 Rolling Spring Dr
- 14749 Rolling Spring Dr
- 14785 Rolling Spring Dr
- 14778 Rolling Spring Dr
- 14748 Rolling Spring Dr
- 1412 Lundy Terrace
- 1448 Lundy Terrace
- 14743 Rolling Spring Dr
Your Personal Tour Guide
Ask me questions while you tour the home.