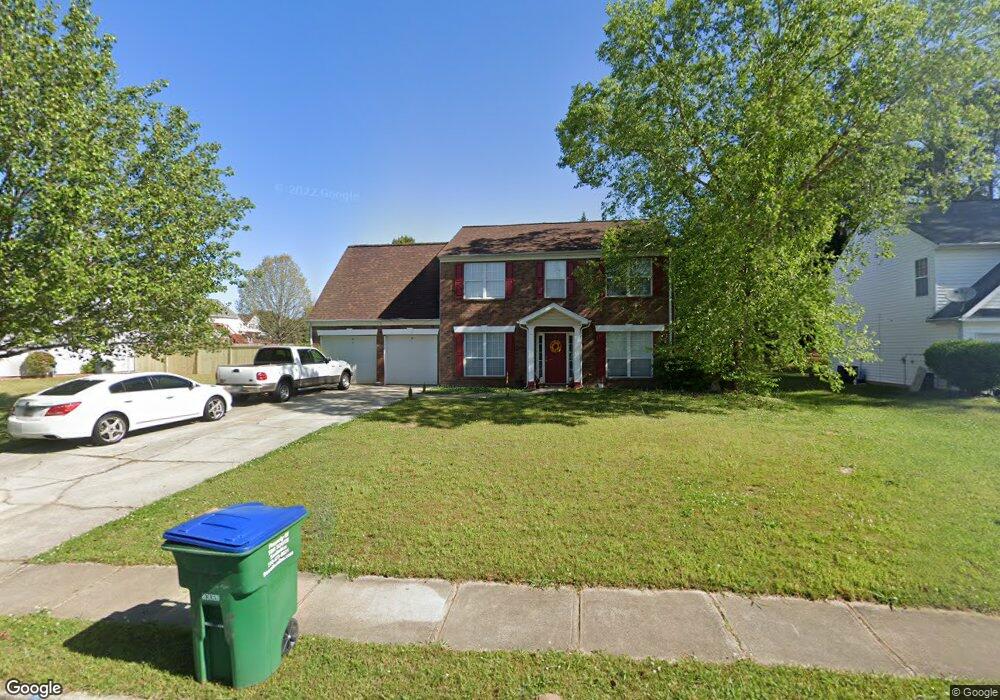
1478 Hyde Ct Unit 5 Hampton, GA 30228
Estimated Value: $256,000 - $297,000
3
Beds
3
Baths
2,162
Sq Ft
$128/Sq Ft
Est. Value
About This Home
This home is located at 1478 Hyde Ct Unit 5, Hampton, GA 30228 and is currently estimated at $276,569, approximately $127 per square foot. 1478 Hyde Ct Unit 5 is a home located in Clayton County with nearby schools including Kemp Primary School, Kemp Elementary School, and Eddie White Academy.
Ownership History
Date
Name
Owned For
Owner Type
Purchase Details
Closed on
Mar 13, 2019
Sold by
Murphy Annie
Bought by
Cox Yasheca Keychaun and Cox Micheal Keith
Current Estimated Value
Home Financials for this Owner
Home Financials are based on the most recent Mortgage that was taken out on this home.
Original Mortgage
$159,556
Outstanding Balance
$141,460
Interest Rate
5.12%
Mortgage Type
FHA
Estimated Equity
$135,110
Purchase Details
Closed on
Nov 1, 2016
Sold by
Lin Phung Chu
Bought by
Murphy Annie
Purchase Details
Closed on
Sep 11, 2009
Sold by
Veterans Admn
Bought by
Lin Phung C
Purchase Details
Closed on
Jul 1, 2008
Sold by
Homebanc Mortgage Corp
Bought by
Veterans Admn
Purchase Details
Closed on
Sep 30, 1998
Sold by
Horton-Torrey D R
Bought by
Frazier Robert V and Frazier Monique S
Home Financials for this Owner
Home Financials are based on the most recent Mortgage that was taken out on this home.
Original Mortgage
$125,950
Interest Rate
6.8%
Mortgage Type
VA
Create a Home Valuation Report for This Property
The Home Valuation Report is an in-depth analysis detailing your home's value as well as a comparison with similar homes in the area
Home Values in the Area
Average Home Value in this Area
Purchase History
| Date | Buyer | Sale Price | Title Company |
|---|---|---|---|
| Cox Yasheca Keychaun | $162,500 | -- | |
| Cox Yasheca Keychaun | $162,500 | -- | |
| Murphy Annie | $96,100 | -- | |
| Murphy Annie | $96,100 | -- | |
| Lin Phung C | -- | -- | |
| Lin Phung C | -- | -- | |
| Veterans Admn | -- | -- | |
| First Horizon Home Loans | $105,756 | -- | |
| Veterans Admn | -- | -- | |
| First Horizon Home Loans | $105,756 | -- | |
| Frazier Robert V | $123,500 | -- | |
| Frazier Robert V | $123,500 | -- |
Source: Public Records
Mortgage History
| Date | Status | Borrower | Loan Amount |
|---|---|---|---|
| Open | Cox Yasheca Keychaun | $159,556 | |
| Previous Owner | Frazier Robert V | $125,950 |
Source: Public Records
Tax History
| Year | Tax Paid | Tax Assessment Tax Assessment Total Assessment is a certain percentage of the fair market value that is determined by local assessors to be the total taxable value of land and additions on the property. | Land | Improvement |
|---|---|---|---|---|
| 2025 | $4,260 | $120,240 | $8,800 | $111,440 |
| 2024 | $4,365 | $120,920 | $8,800 | $112,120 |
| 2023 | $4,214 | $116,720 | $8,800 | $107,920 |
| 2022 | $3,576 | $100,160 | $8,800 | $91,360 |
| 2021 | $2,801 | $79,960 | $8,800 | $71,160 |
| 2020 | $2,238 | $65,000 | $8,800 | $56,200 |
| 2019 | $2,573 | $62,450 | $6,400 | $56,050 |
| 2018 | $1,644 | $49,563 | $6,400 | $43,163 |
| 2017 | $1,602 | $38,440 | $6,400 | $32,040 |
| 2016 | $1,743 | $41,889 | $6,400 | $35,489 |
| 2015 | $1,729 | $0 | $0 | $0 |
| 2014 | $1,076 | $26,106 | $6,400 | $19,706 |
Source: Public Records
Map
Nearby Homes
- 10664 Sandpiper Rd
- 1578 Pintail Rd
- 1605 Plover Rd
- 10897 Paladin Dr
- 10571 Starling Trail Unit II
- 10747 Thrasher Rd
- 10725 Barberry Dr Unit 5
- 1697 Cardinal Rd
- 1702 Cardinal Rd
- 10617 Barberry Dr
- 1441 Trellis Ct
- 1441 Trellis Ct Unit (LOT 7)
- 1429 Trellis Ct Unit (LOT 9)
- 1429 Trellis Ct
- 1589 Bonanza Church Rd
- 1350 Birdsong Ln
- 1434 Trellis Ct
- 1434 Trellis Ct Unit (LOT 24)
- 1428 Trellis Ct Unit (LOT 23)
- 1428 Trellis Ct
- 1478 Hyde Ct
- 1478 Hyde Ct Unit 54
- 1486 Hyde Ct
- 1470 Hyde Ct
- 1479 Buckingham Ct Unit IV
- 1471 Buckingham Ct Unit IV
- 1487 Buckingham Ct
- 1475 Hyde Ct
- 1483 Hyde Ct
- 10760 Paladin Dr Unit V
- 1467 Hyde Ct
- 1467 Hyde Ct Unit 97
- 10752 Paladin Dr
- 10744 Paladin Dr Unit IV
- 10774 Paladin Dr
- 1512 Cardinal Rd
- 10708 Panhandle Rd
- 1511 Cardinal Rd
- 10782 Paladin Dr Unit V
- 1476 Leicster Ct
Your Personal Tour Guide
Ask me questions while you tour the home.