Estimated Value: $2,107,383 - $2,333,000
3
Beds
2
Baths
2,050
Sq Ft
$1,087/Sq Ft
Est. Value
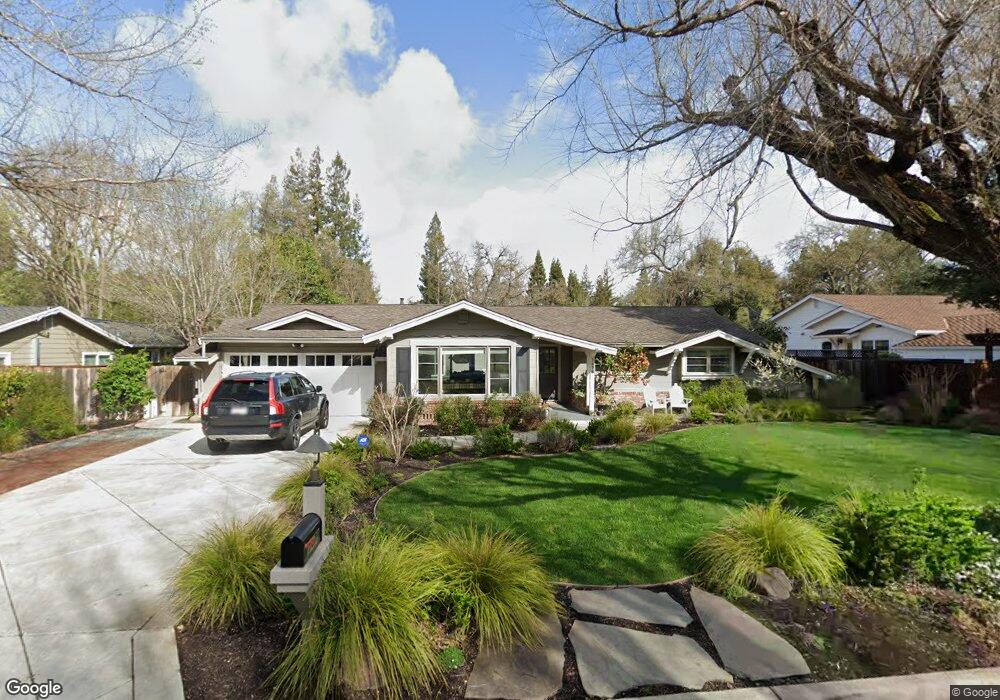
About This Home
This home is located at 1478 Via Don Jose, Alamo, CA 94507 and is currently estimated at $2,229,096, approximately $1,087 per square foot. 1478 Via Don Jose is a home located in Contra Costa County with nearby schools including Stone Valley Middle School, San Ramon Valley High School, and St. Isidore School.
Ownership History
Date
Name
Owned For
Owner Type
Purchase Details
Closed on
Oct 2, 2015
Sold by
Hudock Ryan A and Hudock Melanie
Bought by
Hudock Family Trust
Current Estimated Value
Purchase Details
Closed on
Mar 19, 2015
Sold by
Larkin David J and Larkin Patricia C
Bought by
Hudock Ryan A and Hudock Melanie
Home Financials for this Owner
Home Financials are based on the most recent Mortgage that was taken out on this home.
Original Mortgage
$1,144,000
Outstanding Balance
$875,218
Interest Rate
3.65%
Mortgage Type
New Conventional
Estimated Equity
$1,353,878
Purchase Details
Closed on
May 21, 2014
Sold by
Flores Carl Nicholas and Flores Frances M
Bought by
Larkin David J and Larkin Patricia C
Home Financials for this Owner
Home Financials are based on the most recent Mortgage that was taken out on this home.
Original Mortgage
$625,500
Interest Rate
4.37%
Mortgage Type
Adjustable Rate Mortgage/ARM
Create a Home Valuation Report for This Property
The Home Valuation Report is an in-depth analysis detailing your home's value as well as a comparison with similar homes in the area
Home Values in the Area
Average Home Value in this Area
Purchase History
| Date | Buyer | Sale Price | Title Company |
|---|---|---|---|
| Hudock Family Trust | -- | None Available | |
| Hudock Ryan A | $1,430,000 | Old Republic Title Co | |
| Larkin David J | $1,200,000 | Chicago Title Company |
Source: Public Records
Mortgage History
| Date | Status | Borrower | Loan Amount |
|---|---|---|---|
| Open | Hudock Ryan A | $1,144,000 | |
| Previous Owner | Larkin David J | $625,500 |
Source: Public Records
Tax History Compared to Growth
Tax History
| Year | Tax Paid | Tax Assessment Tax Assessment Total Assessment is a certain percentage of the fair market value that is determined by local assessors to be the total taxable value of land and additions on the property. | Land | Improvement |
|---|---|---|---|---|
| 2025 | $19,719 | $1,761,874 | $1,111,706 | $650,168 |
| 2024 | $19,421 | $1,727,328 | $1,089,908 | $637,420 |
| 2023 | $19,421 | $1,693,460 | $1,068,538 | $624,922 |
| 2022 | $19,279 | $1,660,256 | $1,047,587 | $612,669 |
| 2021 | $18,872 | $1,627,703 | $1,027,047 | $600,656 |
| 2019 | $18,460 | $1,579,427 | $996,585 | $582,842 |
| 2018 | $17,543 | $1,527,459 | $977,045 | $550,414 |
| 2017 | $16,729 | $1,480,843 | $957,888 | $522,955 |
| 2016 | $16,541 | $1,451,807 | $939,106 | $512,701 |
| 2015 | $14,094 | $1,223,976 | $917,982 | $305,994 |
| 2014 | $12,370 | $102,423 | $32,447 | $69,976 |
Source: Public Records
Map
Nearby Homes
- 81 N Jackson Way
- 1588 Alamo Way
- 72 Orchard Ct
- 1408 Entrada Verde
- 3139 Via Larga
- 1271 Laverock Ln
- 136 Sugarloaf Ct
- 1021 Via Del Gato
- 957 Ina Dr
- 1111 Stone Valley Rd
- 1570 Las Trampas Rd
- 77 Pleasant Knoll Ct
- 188 Alamo Square
- 2559 Romley Ln
- 200 Lark Ln
- 361 Castle Crest Rd
- 2990 Limestone Rd
- 0 Lark Ln Unit 41084062
- 4 La Serena Way
- 2435 Lunada Ln
- 1488 Via Don Jose
- 1468 Via Don Jose
- 1498 Via Don Jose
- 1458 Via Don Jose
- 1471 Cedar Ln
- 1461 Cedar Ln
- 2960 Danville Blvd
- 1479 Via Don Jose
- 1489 Via Don Jose
- 1441 Cedar Ln
- 1469 Via Don Jose
- 1448 Via Don Jose
- 1491 Cedar Ln
- 1499 Via Don Jose
- 1459 Via Don Jose
- 1431 Cedar Ln
- 1490 Cedar Ln
- 1487 Pine Tree Dr
- 90 Gran Viaduct
- 1438 Via Don Jose