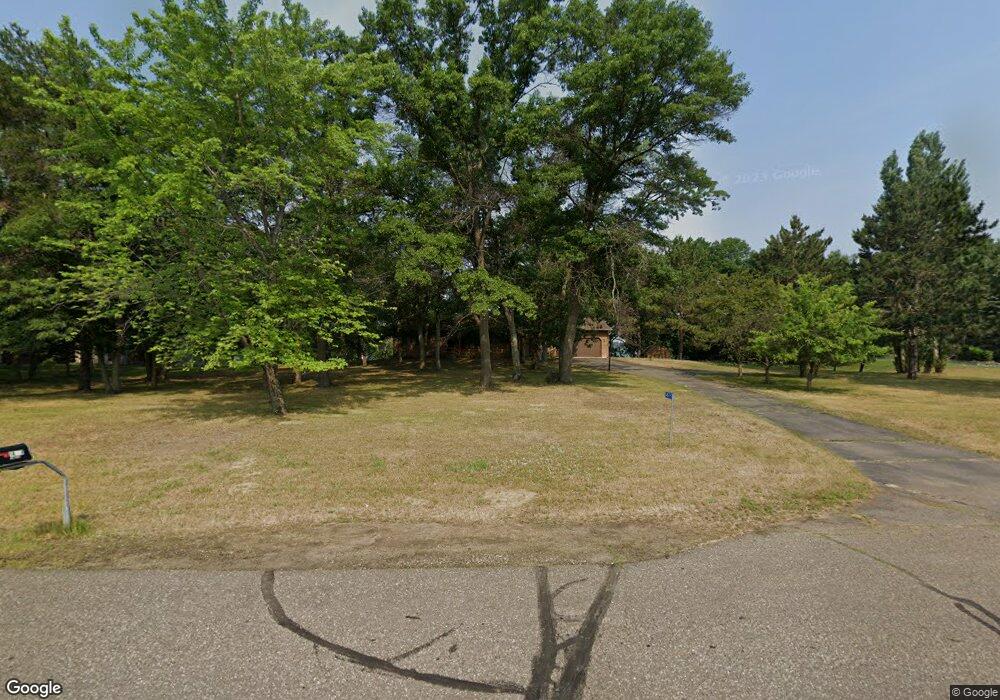
14789 Lynndale Ln Baxter, MN 56425
Estimated Value: $455,633 - $607,000
3
Beds
2
Baths
1,294
Sq Ft
$398/Sq Ft
Est. Value
About This Home
This home is located at 14789 Lynndale Ln, Baxter, MN 56425 and is currently estimated at $515,158, approximately $398 per square foot. 14789 Lynndale Ln is a home located in Crow Wing County with nearby schools including Baxter Elementary School, Forestview Middle School, and Brainerd Senior High School.
Ownership History
Date
Name
Owned For
Owner Type
Purchase Details
Closed on
Nov 13, 2025
Sold by
County Of Crow Wing
Bought by
Gaustad Steven A and Gaustad Rychel D
Current Estimated Value
Purchase Details
Closed on
Nov 7, 2025
Sold by
Gaustad Peter L
Bought by
Gaustad Steven A and Gaustad Ry-Chel D
Purchase Details
Closed on
Apr 10, 2025
Sold by
County Of Crow Wing
Bought by
Gaustad Steven A and Gaustad Rychel D
Purchase Details
Closed on
Apr 3, 2025
Sold by
Gaustad Peter L
Bought by
Gaustad Steven A and Gaustad Rychel D
Purchase Details
Closed on
Jul 16, 2024
Sold by
County Of Crow Wing
Bought by
Gaustad Peter Leroy
Purchase Details
Closed on
May 23, 2024
Sold by
Gaustad Steven A and Gaustad Rychel D
Bought by
Gaustad Peter Leroy
Purchase Details
Closed on
May 3, 2024
Sold by
County Of Crow Wing
Bought by
Gaustad Steven A and Gaustad Rychel D
Purchase Details
Closed on
Apr 29, 2024
Sold by
Gaustad Peter Le Ray
Bought by
Gaustad Steven A and Gaustad Rychelo
Create a Home Valuation Report for This Property
The Home Valuation Report is an in-depth analysis detailing your home's value as well as a comparison with similar homes in the area
Home Values in the Area
Average Home Value in this Area
Purchase History
We collect this data history from publicly available records. To have your information removed, we recommend requesting removal directly through your county’s website.
| Date | Buyer | Sale Price | Title Company |
|---|---|---|---|
| Gaustad Steven A | -- | -- | |
| Gaustad Steven A | $500 | None Listed On Document | |
| Gaustad Steven A | -- | -- | |
| Gaustad Steven A | $500 | None Listed On Document | |
| Gaustad Peter Leroy | -- | -- | |
| Gaustad Peter Leroy | $500 | None Listed On Document | |
| Gaustad Steven A | -- | -- | |
| Gaustad Steven A | $500 | None Listed On Document |
Source: Public Records
Tax History
| Year | Tax Paid | Tax Assessment Tax Assessment Total Assessment is a certain percentage of the fair market value that is determined by local assessors to be the total taxable value of land and additions on the property. | Land | Improvement |
|---|---|---|---|---|
| 2025 | $4,380 | $433,100 | $161,600 | $271,500 |
| 2024 | $1,266 | $422,800 | $166,600 | $256,200 |
| 2023 | $4,636 | $404,400 | $135,900 | $268,500 |
| 2022 | $3,576 | $435,600 | $162,000 | $273,600 |
| 2021 | $3,612 | $287,400 | $131,600 | $155,800 |
| 2020 | $3,618 | $282,800 | $131,800 | $151,000 |
| 2019 | $3,648 | $282,300 | $128,500 | $153,800 |
| 2018 | $3,260 | $290,100 | $140,100 | $150,000 |
| 2017 | $3,100 | $264,145 | $122,758 | $141,387 |
| 2016 | $3,166 | $247,600 | $105,400 | $142,200 |
| 2015 | $3,556 | $274,300 | $135,500 | $138,800 |
| 2014 | $1,496 | $235,300 | $104,300 | $131,000 |
Source: Public Records
Map
Nearby Homes
- 14741 Lynndale Ln
- 14502 Lynndale Dr N
- XXX Kimberlee Dr
- TBD Lot 13 Jewelwood Dr
- TBD Lot 14 Jewelwood Dr
- TBD Lot 12 Jewelwood Dr
- TBD Lot 11 Jewelwood Dr
- Outlot A and D Rockrose Dr
- 6195 Cosmos Rd
- 5394 Clearwater Rd
- TBD Clearwater Rd N
- 7205 Clearwater Rd N
- L1&2 B3 Clearwater Rd N
- L1&2 B1 Clearwater Rd N
- 14420 Cottage Grove Dr
- 14093 Cherrywood Dr
- 5152 Camden Rd
- TBD Dahlin Rd N
- 5113 Camden Rd
- 6552 Austin Rd
- 14727 Lynndale Ln
- 14752 Lynndale Ln
- 14797 Lynndale Ln
- 14689 Lynndale Ln
- 14774 Lynndale Ln
- TBD Lyndale Ln N
- TBD Lynndale Ln N
- 14714 Lynndale Ln
- 14714 14714 Lyndale-Lane-
- 14714 Lynndale Ln N
- 14804 Lynndale Ln
- 14835 Lynndale Ln
- 14659 Lynndale Dr
- 14816 Lynndale Ln
- 14736 Lynndale Dr
- 14634 Lynndale Ln
- 14635 Lynndale Dr
- 14859 Lynndale Ln
- 14626 Lynndale Ln
- 14828 Lynndale Ln
Your Personal Tour Guide
Ask me questions while you tour the home.