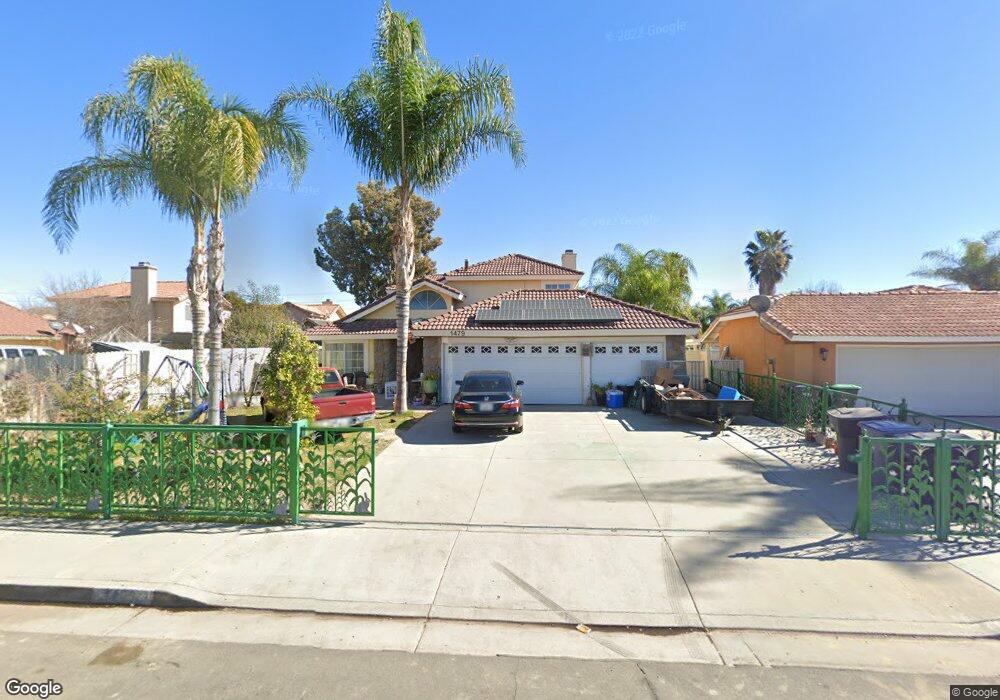
1479 Shady Oaks Dr Perris, CA 92571
Central Perris NeighborhoodEstimated Value: $477,000 - $545,000
4
Beds
3
Baths
1,853
Sq Ft
$276/Sq Ft
Est. Value
About This Home
This home is located at 1479 Shady Oaks Dr, Perris, CA 92571 and is currently estimated at $510,646, approximately $275 per square foot. 1479 Shady Oaks Dr is a home located in Riverside County with nearby schools including Sky View Elementary School, Pinacate Middle School, and Perris High School.
Ownership History
Date
Name
Owned For
Owner Type
Purchase Details
Closed on
Jul 24, 2009
Sold by
Rodriquez Marydena
Bought by
Cardenas Victor M
Current Estimated Value
Home Financials for this Owner
Home Financials are based on the most recent Mortgage that was taken out on this home.
Original Mortgage
$122,735
Interest Rate
5.31%
Mortgage Type
FHA
Purchase Details
Closed on
Jun 11, 2009
Sold by
Us Bank National Association
Bought by
Cardenas Victor M
Home Financials for this Owner
Home Financials are based on the most recent Mortgage that was taken out on this home.
Original Mortgage
$122,735
Interest Rate
5.31%
Mortgage Type
FHA
Purchase Details
Closed on
Nov 6, 2008
Sold by
Gonzalez Cynthia
Bought by
Us Bank National Association
Purchase Details
Closed on
Dec 1, 2005
Sold by
Deleon Heriberto and De Leon Maricela
Bought by
Gonzalez Cynthia
Home Financials for this Owner
Home Financials are based on the most recent Mortgage that was taken out on this home.
Original Mortgage
$387,000
Interest Rate
6.35%
Mortgage Type
Purchase Money Mortgage
Create a Home Valuation Report for This Property
The Home Valuation Report is an in-depth analysis detailing your home's value as well as a comparison with similar homes in the area
Home Values in the Area
Average Home Value in this Area
Purchase History
| Date | Buyer | Sale Price | Title Company |
|---|---|---|---|
| Cardenas Victor M | -- | Chicago Title | |
| Cardenas Victor M | $125,000 | Chicago Title | |
| Us Bank National Association | $154,800 | Accommodation | |
| Gonzalez Cynthia | $387,000 | Alliance Title Riverside |
Source: Public Records
Mortgage History
| Date | Status | Borrower | Loan Amount |
|---|---|---|---|
| Previous Owner | Cardenas Victor M | $122,735 | |
| Previous Owner | Gonzalez Cynthia | $387,000 |
Source: Public Records
Tax History Compared to Growth
Tax History
| Year | Tax Paid | Tax Assessment Tax Assessment Total Assessment is a certain percentage of the fair market value that is determined by local assessors to be the total taxable value of land and additions on the property. | Land | Improvement |
|---|---|---|---|---|
| 2025 | $1,942 | $161,332 | $38,714 | $122,618 |
| 2023 | $1,942 | $155,068 | $37,211 | $117,857 |
| 2022 | $1,922 | $152,029 | $36,482 | $115,547 |
| 2021 | $1,887 | $149,049 | $35,767 | $113,282 |
| 2020 | $1,865 | $147,522 | $35,401 | $112,121 |
| 2019 | $1,825 | $144,630 | $34,707 | $109,923 |
| 2018 | $1,748 | $141,795 | $34,027 | $107,768 |
| 2017 | $1,726 | $139,015 | $33,360 | $105,655 |
| 2016 | $1,694 | $136,290 | $32,706 | $103,584 |
| 2015 | $1,663 | $134,245 | $32,216 | $102,029 |
| 2014 | $1,628 | $131,618 | $31,586 | $100,032 |
Source: Public Records
Map
Nearby Homes
- 1443 Caron Ct
- 1534 Wilson Ave
- 1462 Apple Creek Dr
- 1630 Glenview Dr
- 1529 Arrow Creek Dr
- 702 Clearwater Dr
- 1878 Neptune Dr
- 1562 Remembrance Dr
- 726 Manecita Cir
- 1753 Jade Ave
- 359 Bahia St
- 1560 Gallatin Cir
- 1552 Gallatin Cir
- 1676 Amethyst Dr
- 1210 Trojan Cir
- 701 Citrus Ave
- 1232 Trojan Cir
- 1223 Trojan Cir
- 1231 Trojan Cir
- 1230 Kent Cir
- 1467 Shady Oaks Dr
- 743 Mahogany Ln
- 751 Mahogany Ln
- 1459 Shady Oaks Dr
- 1480 Caron Ct
- 765 Mahogany Ln
- 1468 Caron Ct
- 1453 Shady Oaks Dr
- 771 Mahogany Ln
- 1478 Shady Oaks Dr
- 1490 Shady Oaks Dr
- 1466 Shady Oaks Dr
- 1454 Caron Ct
- 1502 Shady Oaks Dr
- 1458 Shady Oaks Dr
- 1447 Shady Oaks Dr
- 1514 Shady Oaks Dr
- 1452 Shady Oaks Dr
- 744 Mahogany Ln
- 752 Mahogany Ln