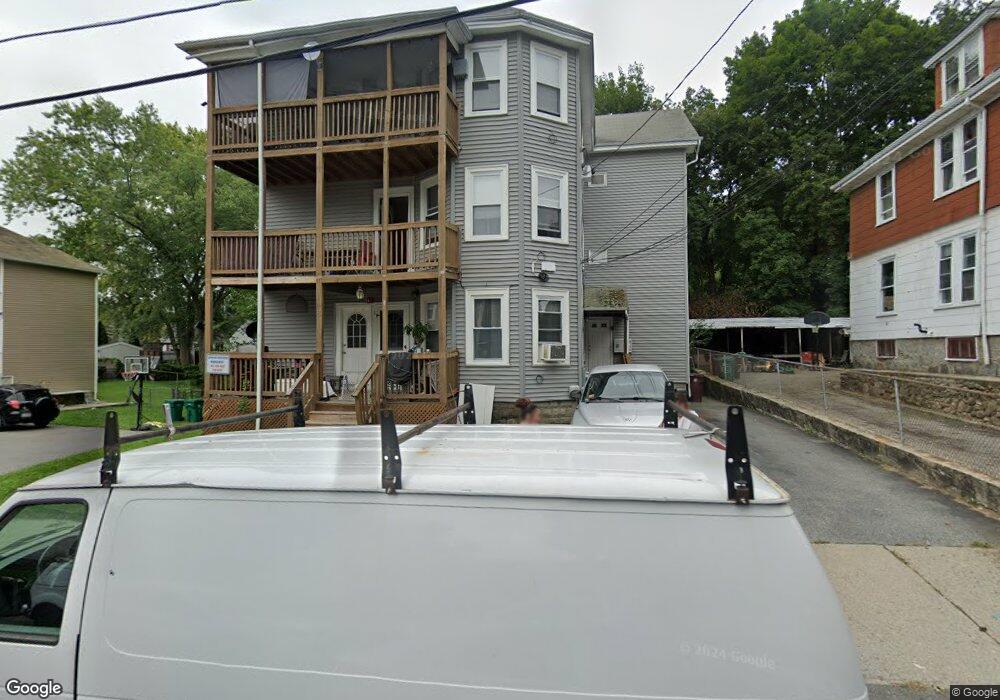
148 7th Ave Woonsocket, RI 02895
Fairmount NeighborhoodEstimated Value: $593,000 - $748,000
11
Beds
14
Baths
4,479
Sq Ft
$144/Sq Ft
Est. Value
About This Home
This home is located at 148 7th Ave, Woonsocket, RI 02895 and is currently estimated at $646,667, approximately $144 per square foot. 148 7th Ave is a home located in Providence County with nearby schools including Woonsocket High School, Rise Prep Mayoral Academy Middle School, and Rise Prep Mayoral Academy.
Ownership History
Date
Name
Owned For
Owner Type
Purchase Details
Closed on
Jan 10, 2018
Sold by
5 Star Properties Llc
Bought by
Johnson Brothers Ri Rl
Current Estimated Value
Purchase Details
Closed on
Jul 6, 2010
Sold by
Aragao Jason
Bought by
5 Star Prop
Purchase Details
Closed on
Oct 16, 2009
Sold by
Rego Sheila P
Bought by
Federal National Mortgage Association
Create a Home Valuation Report for This Property
The Home Valuation Report is an in-depth analysis detailing your home's value as well as a comparison with similar homes in the area
Home Values in the Area
Average Home Value in this Area
Purchase History
| Date | Buyer | Sale Price | Title Company |
|---|---|---|---|
| Johnson Brothers Ri Rl | $4,750,000 | -- | |
| Johnson Brothers Ri Rl | $4,750,000 | -- | |
| 5 Star Prop | $77,000 | -- | |
| Aragao Jason | $64,000 | -- | |
| Aragao Jason | $64,000 | -- | |
| Federal National Mortgage Association | $297,286 | -- | |
| Federal National Mortgage Association | $297,286 | -- |
Source: Public Records
Mortgage History
| Date | Status | Borrower | Loan Amount |
|---|---|---|---|
| Previous Owner | Federal National Mortgage Association | $256,000 |
Source: Public Records
Tax History
| Year | Tax Paid | Tax Assessment Tax Assessment Total Assessment is a certain percentage of the fair market value that is determined by local assessors to be the total taxable value of land and additions on the property. | Land | Improvement |
|---|---|---|---|---|
| 2025 | $8,268 | $736,200 | $87,900 | $648,300 |
| 2024 | $6,273 | $431,400 | $89,500 | $341,900 |
| 2023 | $6,031 | $431,400 | $89,500 | $341,900 |
| 2022 | $6,031 | $431,400 | $89,500 | $341,900 |
| 2021 | $4,505 | $189,700 | $35,600 | $154,100 |
| 2020 | $4,553 | $189,700 | $35,600 | $154,100 |
| 2018 | $4,568 | $189,700 | $35,600 | $154,100 |
| 2017 | $5,135 | $170,600 | $40,000 | $130,600 |
| 2016 | $5,432 | $170,600 | $40,000 | $130,600 |
| 2015 | $6,241 | $170,600 | $40,000 | $130,600 |
| 2014 | $5,937 | $165,200 | $44,000 | $121,200 |
Source: Public Records
Map
Nearby Homes
- 0 10th Ave
- 10 10th Ave
- 123 4th Ave
- 217 4th Ave
- 83 4th Ave
- 435 S Main St
- 0 Holbrook Ln Unit 1402850
- 36 Fairmount St
- 84 Bernice Ave
- 190 Coe St
- 372 River St
- 120 East St
- 0 Pound Hill Rd Unit 1403654
- 0 Pound Hill Rd Unit 1403653
- 43 Summit St
- 184 Avenue C Unit 2
- 184 Avenue C Unit 5
- 184 Avenue C Unit 6
- 184 Avenue C Unit 3
- 184 Avenue C Unit 4
Your Personal Tour Guide
Ask me questions while you tour the home.