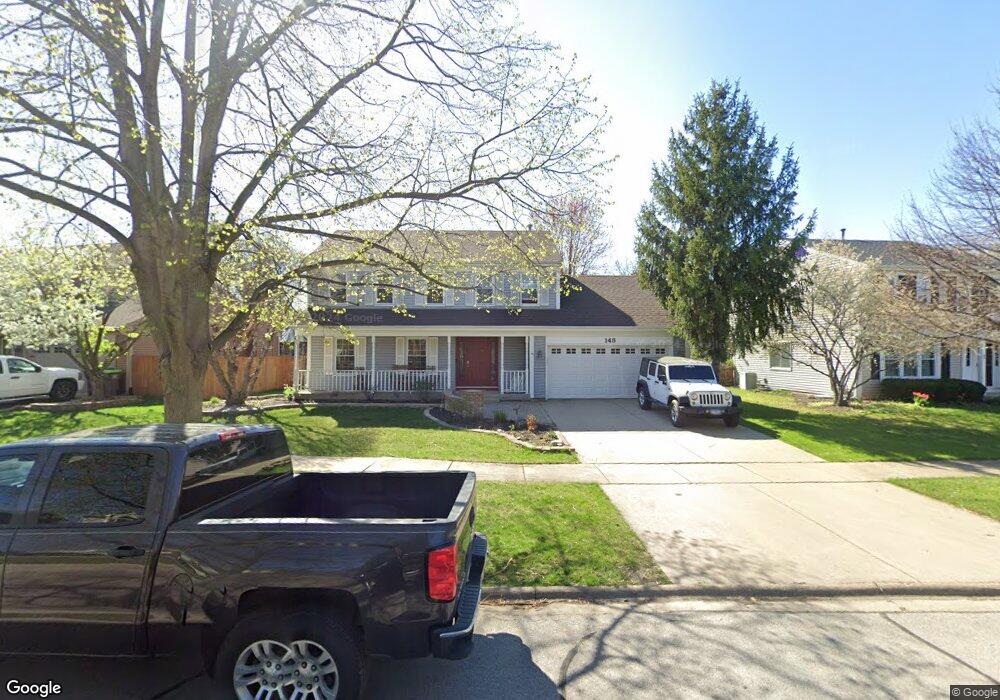
148 Autumn Rdg Dr Montgomery, IL 60538
Briarcliff Woods NeighborhoodEstimated Value: $331,000 - $386,000
4
Beds
3
Baths
2,080
Sq Ft
$171/Sq Ft
Est. Value
About This Home
This home is located at 148 Autumn Rdg Dr, Montgomery, IL 60538 and is currently estimated at $356,148, approximately $171 per square foot. 148 Autumn Rdg Dr is a home located in Kendall County with nearby schools including Boulder Hill Elementary School, Thompson Jr. High School, and Oswego High School.
Ownership History
Date
Name
Owned For
Owner Type
Purchase Details
Closed on
Jul 21, 2021
Sold by
Arevalo Carlos and Arevalo Claudia
Bought by
Rodriguez Hugo and Rodriguez Janeth
Current Estimated Value
Home Financials for this Owner
Home Financials are based on the most recent Mortgage that was taken out on this home.
Original Mortgage
$167,000
Outstanding Balance
$151,596
Interest Rate
2.93%
Mortgage Type
New Conventional
Estimated Equity
$204,552
Purchase Details
Closed on
Mar 9, 2004
Sold by
Wells Fargo Financial Illinois Inc
Bought by
Arevalo Carlos and Arevalo Claudia
Home Financials for this Owner
Home Financials are based on the most recent Mortgage that was taken out on this home.
Original Mortgage
$172,800
Interest Rate
5.5%
Mortgage Type
Purchase Money Mortgage
Purchase Details
Closed on
Oct 30, 2003
Sold by
Keysler Louis W and Keysler Karen C
Bought by
Wells Fargo Financial Illinois Inc
Purchase Details
Closed on
Sep 1, 1991
Bought by
Keyster Louis W and Keyster Karen G
Create a Home Valuation Report for This Property
The Home Valuation Report is an in-depth analysis detailing your home's value as well as a comparison with similar homes in the area
Home Values in the Area
Average Home Value in this Area
Purchase History
| Date | Buyer | Sale Price | Title Company |
|---|---|---|---|
| Rodriguez Hugo | $209,000 | Chicago Title Insurance Co | |
| Arevalo Carlos | $216,000 | Fatic | |
| Wells Fargo Financial Illinois Inc | -- | -- | |
| Keyster Louis W | $157,600 | -- |
Source: Public Records
Mortgage History
| Date | Status | Borrower | Loan Amount |
|---|---|---|---|
| Open | Rodriguez Hugo | $167,000 | |
| Previous Owner | Arevalo Carlos | $172,800 | |
| Closed | Keyster Louis W | -- |
Source: Public Records
Tax History Compared to Growth
Tax History
| Year | Tax Paid | Tax Assessment Tax Assessment Total Assessment is a certain percentage of the fair market value that is determined by local assessors to be the total taxable value of land and additions on the property. | Land | Improvement |
|---|---|---|---|---|
| 2024 | $8,851 | $112,977 | $26,298 | $86,679 |
| 2023 | $8,127 | $101,781 | $23,692 | $78,089 |
| 2022 | $8,127 | $93,377 | $21,736 | $71,641 |
| 2021 | $7,835 | $87,268 | $20,314 | $66,954 |
| 2020 | $7,448 | $82,328 | $19,164 | $63,164 |
| 2019 | $6,989 | $76,586 | $19,164 | $57,422 |
| 2018 | $7,159 | $76,586 | $19,164 | $57,422 |
| 2017 | $7,029 | $72,251 | $18,079 | $54,172 |
| 2016 | $6,919 | $70,146 | $17,552 | $52,594 |
| 2015 | $7,001 | $67,773 | $16,958 | $50,815 |
| 2014 | -- | $65,799 | $16,464 | $49,335 |
| 2013 | -- | $66,463 | $16,630 | $49,833 |
Source: Public Records
Map
Nearby Homes
- 133 Autumn Rdg Dr
- 1707 Deer Run Dr
- 101 Red Fox Run
- 75 Briarcliff Rd
- 1417 Manning Ave
- 1375 Manning Ave
- 1405 Manning Ave
- 1422 Manning Ave
- 170 Montgomery Rd
- 37 Fallcreek Cir
- 1342 Oak Ridge Ln
- 36 Fallcreek Cir Unit 35
- 106 Hamlet Cir
- 34 Pembrooke Rd
- 114 Heathgate Rd
- 124 Heathgate Rd
- 106 Braeburn Rd
- 136 Heathgate Rd
- 17 Knollwood Dr Unit 3
- 19 Wyndham Dr Unit 10
- 144 Autumn Rdg Dr
- 150 Autumn Rdg Dr Unit 3
- 150 Autumn Ridge Dr
- 1780 Sunrise Ct
- 142 Autumn Rdg Dr
- 152 Autumn Ridge Dr
- 152 Autumn Rdg Dr
- 1670 Timber Lane Dr
- 147 Autumn Ridge Dr
- 1770 Sunrise Ct
- 147 Autumn Rdg Dr
- 149 Autumn Rdg Dr
- 151 Autumn Rdg Dr
- 145 Autumn Rdg Dr
- 140 Autumn Rdg Dr
- 1674 Timber Lane Dr
- 1660 Timber Lane Dr
- 143 Autumn Rdg Dr
- 1765 Sunrise Ct
- 1680 Timber Lane Dr Unit 3