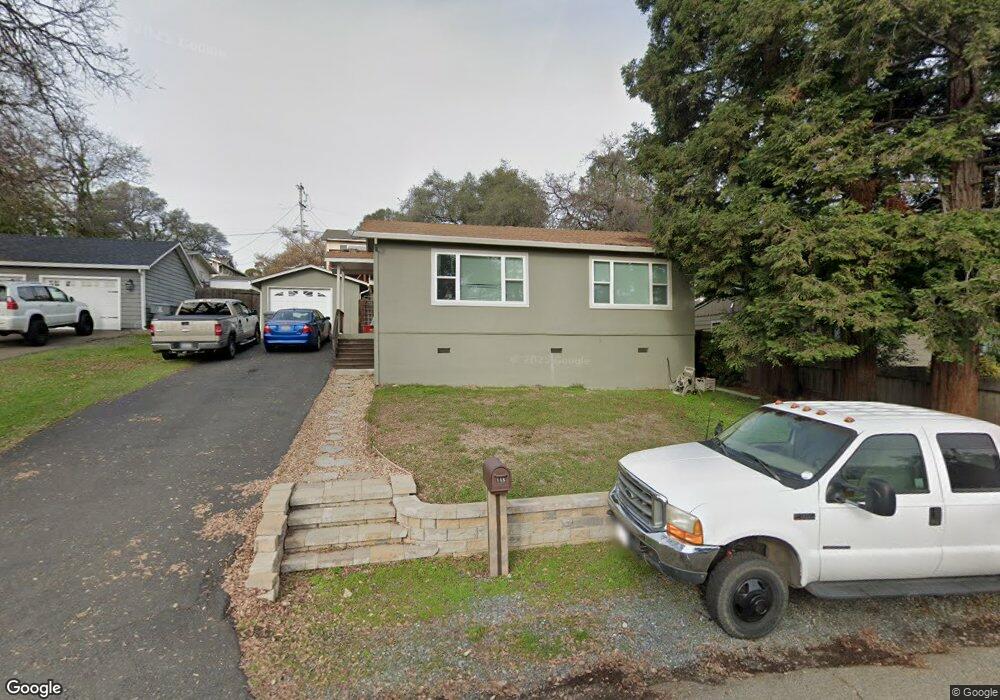
148 Diamond St Auburn, CA 95603
Estimated Value: $382,628 - $470,000
2
Beds
1
Bath
910
Sq Ft
$464/Sq Ft
Est. Value
About This Home
This home is located at 148 Diamond St, Auburn, CA 95603 and is currently estimated at $422,657, approximately $464 per square foot. 148 Diamond St is a home located in Placer County with nearby schools including Skyridge Elementary School, Placer High School, and Alta Vista Community Charter.
Ownership History
Date
Name
Owned For
Owner Type
Purchase Details
Closed on
Jul 2, 2018
Sold by
Myers Debbera L
Bought by
Myers Christopher and Myers Debbera
Current Estimated Value
Home Financials for this Owner
Home Financials are based on the most recent Mortgage that was taken out on this home.
Original Mortgage
$193,000
Outstanding Balance
$167,633
Interest Rate
4.6%
Mortgage Type
New Conventional
Estimated Equity
$255,024
Purchase Details
Closed on
Nov 23, 2004
Sold by
Myers Debbera L and Lovett Debbera L
Bought by
Myers Debbera L
Home Financials for this Owner
Home Financials are based on the most recent Mortgage that was taken out on this home.
Original Mortgage
$165,000
Interest Rate
5.72%
Mortgage Type
New Conventional
Purchase Details
Closed on
Jul 30, 1997
Sold by
Manning John R and Manning Julie D
Bought by
Lovett Debbera L
Home Financials for this Owner
Home Financials are based on the most recent Mortgage that was taken out on this home.
Original Mortgage
$103,886
Interest Rate
7.58%
Mortgage Type
FHA
Create a Home Valuation Report for This Property
The Home Valuation Report is an in-depth analysis detailing your home's value as well as a comparison with similar homes in the area
Home Values in the Area
Average Home Value in this Area
Purchase History
| Date | Buyer | Sale Price | Title Company |
|---|---|---|---|
| Myers Christopher | -- | Placer Title Co | |
| Myers Debbera L | -- | Financial Title Company | |
| Lovett Debbera L | $105,000 | Old Republic Title Company |
Source: Public Records
Mortgage History
| Date | Status | Borrower | Loan Amount |
|---|---|---|---|
| Open | Myers Christopher | $193,000 | |
| Closed | Myers Debbera L | $165,000 | |
| Closed | Lovett Debbera L | $103,886 |
Source: Public Records
Tax History
| Year | Tax Paid | Tax Assessment Tax Assessment Total Assessment is a certain percentage of the fair market value that is determined by local assessors to be the total taxable value of land and additions on the property. | Land | Improvement |
|---|---|---|---|---|
| 2025 | $2,701 | $167,630 | $79,824 | $87,806 |
| 2023 | $2,701 | $161,123 | $76,725 | $84,398 |
| 2022 | $2,673 | $157,965 | $75,221 | $82,744 |
| 2021 | $2,611 | $154,869 | $73,747 | $81,122 |
| 2020 | $2,599 | $153,282 | $72,991 | $80,291 |
| 2019 | $2,568 | $150,277 | $71,560 | $78,717 |
| 2018 | $2,481 | $147,331 | $70,157 | $77,174 |
| 2017 | $2,416 | $144,443 | $68,782 | $75,661 |
| 2016 | $2,349 | $141,612 | $67,434 | $74,178 |
| 2015 | $2,280 | $139,486 | $66,422 | $73,064 |
| 2014 | $2,224 | $136,754 | $65,121 | $71,633 |
Source: Public Records
Map
Nearby Homes
- 160 Walker Dr
- 111 Electric St
- 330 Foresthill Ave
- 681 Foresthill Ave
- 121 Aeolia Dr
- 232 Foresthill Ave Unit B
- 13017 Lincoln Way Unit 92
- 228 Foresthill Ave Unit B
- 13053 Lincoln Way Unit D
- 227 Swenson Ct
- 13065 Lincoln Way Unit B
- 13067 Lincoln Way Unit D
- 150 Center St
- 860 Auburn Ravine Rd
- 438 Olive Orchard Dr
- 55 Neils
- 0 Dairy Rd Unit 225137062
- 413 Orchard Ct
- 811 Auburn Ravine Rd
- 34-35 Grass Valley Hwy
Your Personal Tour Guide
Ask me questions while you tour the home.