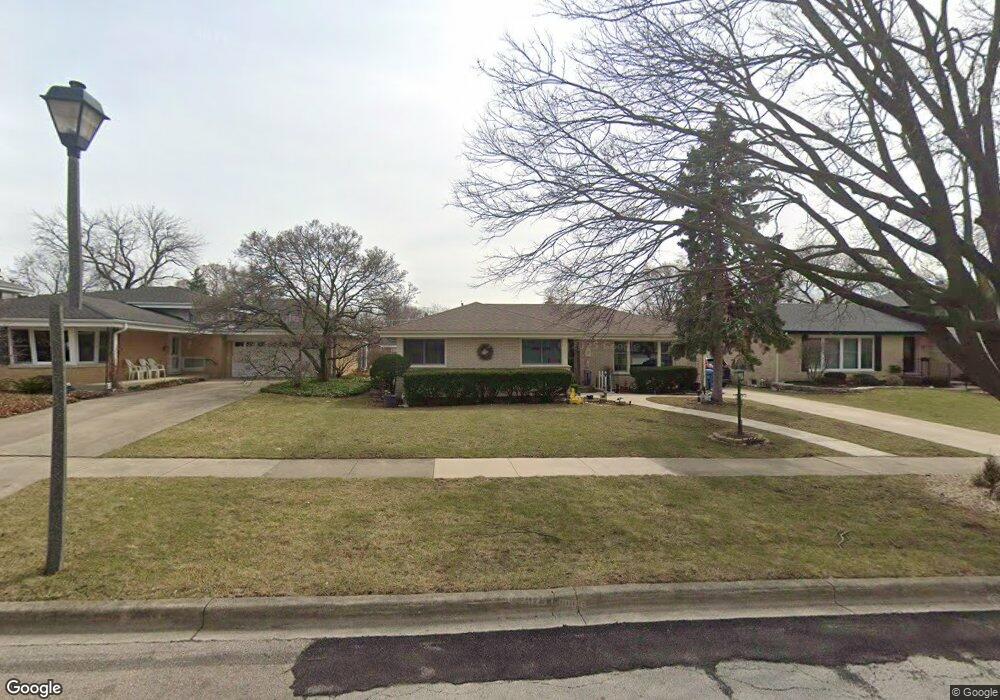
148 E Quincy St Elmhurst, IL 60126
Estimated Value: $728,302 - $806,000
Studio
--
Bath
1,950
Sq Ft
$390/Sq Ft
Est. Value
About This Home
This home is located at 148 E Quincy St, Elmhurst, IL 60126 and is currently estimated at $760,076, approximately $389 per square foot. 148 E Quincy St is a home located in DuPage County with nearby schools including Jackson Elementary School, Bryan Middle School, and York Community High School.
Ownership History
Date
Name
Owned For
Owner Type
Purchase Details
Closed on
Aug 25, 1997
Sold by
Stone Mark H and Stone Betty M
Bought by
Thoresen Kenneth G and Thoresen Nancy A
Current Estimated Value
Home Financials for this Owner
Home Financials are based on the most recent Mortgage that was taken out on this home.
Original Mortgage
$165,000
Outstanding Balance
$25,796
Interest Rate
7.57%
Estimated Equity
$734,280
Create a Home Valuation Report for This Property
The Home Valuation Report is an in-depth analysis detailing your home's value as well as a comparison with similar homes in the area
Home Values in the Area
Average Home Value in this Area
Purchase History
| Date | Buyer | Sale Price | Title Company |
|---|---|---|---|
| Thoresen Kenneth G | $268,000 | -- |
Source: Public Records
Mortgage History
| Date | Status | Borrower | Loan Amount |
|---|---|---|---|
| Open | Thoresen Kenneth G | $165,000 |
Source: Public Records
Tax History Compared to Growth
Tax History
| Year | Tax Paid | Tax Assessment Tax Assessment Total Assessment is a certain percentage of the fair market value that is determined by local assessors to be the total taxable value of land and additions on the property. | Land | Improvement |
|---|---|---|---|---|
| 2024 | $11,337 | $204,114 | $101,857 | $102,257 |
| 2023 | $10,487 | $188,750 | $94,190 | $94,560 |
| 2022 | $10,638 | $181,430 | $90,530 | $90,900 |
| 2021 | $10,375 | $176,920 | $88,280 | $88,640 |
| 2020 | $9,974 | $173,050 | $86,350 | $86,700 |
| 2019 | $9,765 | $164,530 | $82,100 | $82,430 |
| 2018 | $9,815 | $164,430 | $77,710 | $86,720 |
| 2017 | $9,601 | $156,690 | $74,050 | $82,640 |
| 2016 | $9,400 | $147,610 | $69,760 | $77,850 |
| 2015 | $9,308 | $137,520 | $64,990 | $72,530 |
| 2014 | $10,669 | $144,450 | $51,580 | $92,870 |
| 2013 | $10,553 | $146,490 | $52,310 | $94,180 |
Source: Public Records
Map
Nearby Homes
- 142 E Quincy St
- 837 S Kearsage Ave
- 788 S Cambridge Ave
- 900 S Colfax Ave
- 694 S York St
- 323 E Butterfield Rd
- 680 S Bryan St
- 110 W Butterfield Rd Unit 502S
- 936 S Mitchell Ave
- 353 E Butterfield Rd
- 1005 S Mitchell Ave
- 274 E Crescent Ave
- 850 S Saylor Ave
- 963 S Saylor Ave
- 801 S Spring Rd
- 580 S Kearsage Ave
- 868 S Spring Rd
- 15W320 Concord St
- 570 S Parkside Ave
- 618 S Swain Ave
- 152 E Quincy St
- 156 E Quincy St
- 149 E Jackson St
- 851 S Kent Ave
- 134 E Quincy St
- 162 E Quincy St
- 159 E Jackson St
- 159 E Jackson St
- 857 S Kent Ave
- 149 E Quincy St
- 143 E Quincy St
- 155 E Quincy St
- 133 E Jackson St
- 133 E Quincy St
- 161 E Quincy St
- 163 E Jackson St
- 166 E Quincy St
- 165 E Quincy St
- 831 S Kent Ave
- 167 E Jackson St