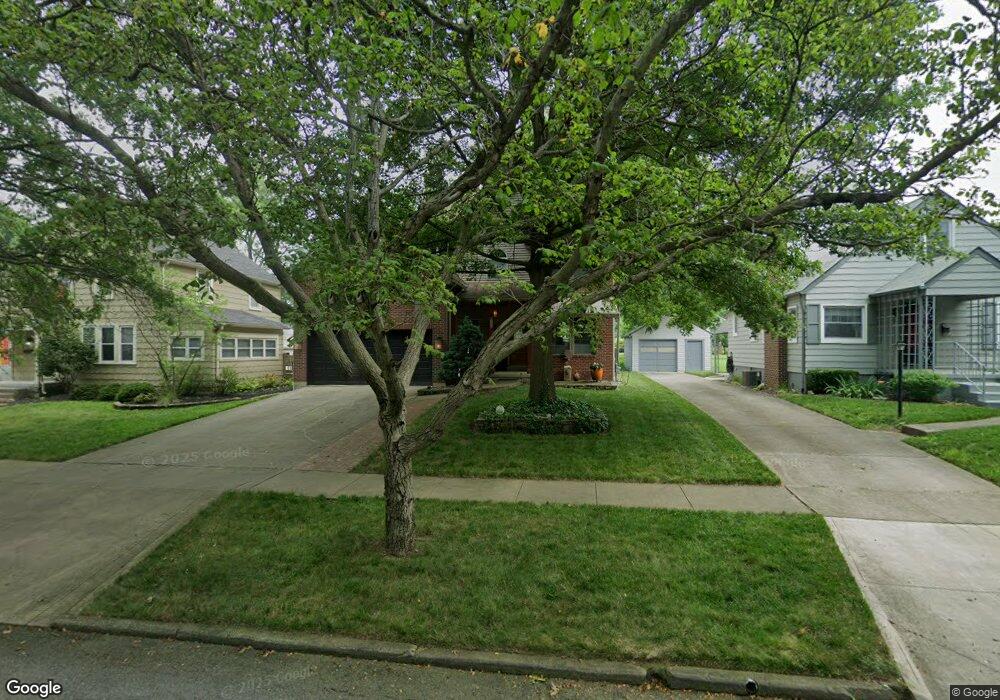
148 Garden Rd Columbus, OH 43214
Clintonville NeighborhoodEstimated Value: $569,000 - $669,000
3
Beds
3
Baths
2,289
Sq Ft
$273/Sq Ft
Est. Value
About This Home
This home is located at 148 Garden Rd, Columbus, OH 43214 and is currently estimated at $624,190, approximately $272 per square foot. 148 Garden Rd is a home located in Franklin County with nearby schools including Indian Springs Elementary School, Dominion Middle School, and Whetstone High School.
Ownership History
Date
Name
Owned For
Owner Type
Purchase Details
Closed on
Aug 30, 2005
Sold by
Cooper Matthew
Bought by
Haight John A and Tsamous Leah K
Current Estimated Value
Home Financials for this Owner
Home Financials are based on the most recent Mortgage that was taken out on this home.
Original Mortgage
$296,910
Outstanding Balance
$158,348
Interest Rate
5.8%
Mortgage Type
Purchase Money Mortgage
Estimated Equity
$465,842
Purchase Details
Closed on
Jun 12, 2000
Sold by
Cooper Adam L
Bought by
Cooper Matthew
Home Financials for this Owner
Home Financials are based on the most recent Mortgage that was taken out on this home.
Original Mortgage
$165,000
Interest Rate
8.14%
Mortgage Type
Construction
Purchase Details
Closed on
Oct 11, 1994
Sold by
Laughlin Michael J
Bought by
Stauffer Brad R and Stauffer Louise A
Home Financials for this Owner
Home Financials are based on the most recent Mortgage that was taken out on this home.
Original Mortgage
$120,600
Interest Rate
5.37%
Mortgage Type
New Conventional
Purchase Details
Closed on
Jul 10, 1987
Purchase Details
Closed on
May 1, 1985
Create a Home Valuation Report for This Property
The Home Valuation Report is an in-depth analysis detailing your home's value as well as a comparison with similar homes in the area
Home Values in the Area
Average Home Value in this Area
Purchase History
| Date | Buyer | Sale Price | Title Company |
|---|---|---|---|
| Haight John A | $329,900 | -- | |
| Cooper Matthew | $45,000 | -- | |
| Stauffer Brad R | $134,000 | -- | |
| -- | $77,000 | -- | |
| -- | -- | -- |
Source: Public Records
Mortgage History
| Date | Status | Borrower | Loan Amount |
|---|---|---|---|
| Open | Haight John A | $296,910 | |
| Closed | Cooper Matthew | $165,000 | |
| Closed | Stauffer Brad R | $120,600 |
Source: Public Records
Tax History Compared to Growth
Tax History
| Year | Tax Paid | Tax Assessment Tax Assessment Total Assessment is a certain percentage of the fair market value that is determined by local assessors to be the total taxable value of land and additions on the property. | Land | Improvement |
|---|---|---|---|---|
| 2024 | $7,903 | $176,090 | $52,680 | $123,410 |
| 2023 | $7,802 | $176,085 | $52,675 | $123,410 |
| 2022 | $8,272 | $159,500 | $37,560 | $121,940 |
| 2021 | $8,287 | $159,500 | $37,560 | $121,940 |
| 2020 | $8,298 | $159,500 | $37,560 | $121,940 |
| 2019 | $7,506 | $123,730 | $28,880 | $94,850 |
| 2018 | $6,690 | $123,730 | $28,880 | $94,850 |
| 2017 | $6,995 | $123,730 | $28,880 | $94,850 |
| 2016 | $6,488 | $97,940 | $21,390 | $76,550 |
| 2015 | $5,890 | $97,940 | $21,390 | $76,550 |
| 2014 | $5,904 | $97,940 | $21,390 | $76,550 |
| 2013 | $2,773 | $93,275 | $20,370 | $72,905 |
Source: Public Records
Map
Nearby Homes
- 156 E Weisheimer Rd
- 255 Garden Rd
- 247 E Jeffrey Place
- 278 E Dominion Blvd
- 134 E Jeffrey Place
- 26 E Schreyer Place
- 4 W Royal Forest Blvd
- 243 E Schreyer Place
- 411 Garden Rd
- 343 E Jeffrey Place
- 420 E Beechwold Blvd
- 381 E Jeffrey Place
- 475 Garden Rd
- 224 Morse Rd
- 142 W Schreyer Place
- 116 Rathbone Ave
- 93 Leland Ave
- 122 W Henderson Rd
- 4464 Zeller Rd
- 111 W Henderson Rd
- 140 Garden Rd
- 154 Garden Rd
- 134 Garden Rd
- 162 Garden Rd
- 168 Garden Rd
- 149 E Beaumont Rd
- 0 E Beaumont Rd
- 120 Garden Rd
- 176 Garden Rd
- 141 E Beaumont Rd
- 161 E Beaumont Rd
- 135 E Beaumont Rd
- 167 E Beaumont Rd
- 129 E Beaumont Rd
- 114 Garden Rd
- 182 Garden Rd
- 145 Garden Rd
- 133 Garden Rd
- 165 Garden Rd
- 175 E Beaumont Rd