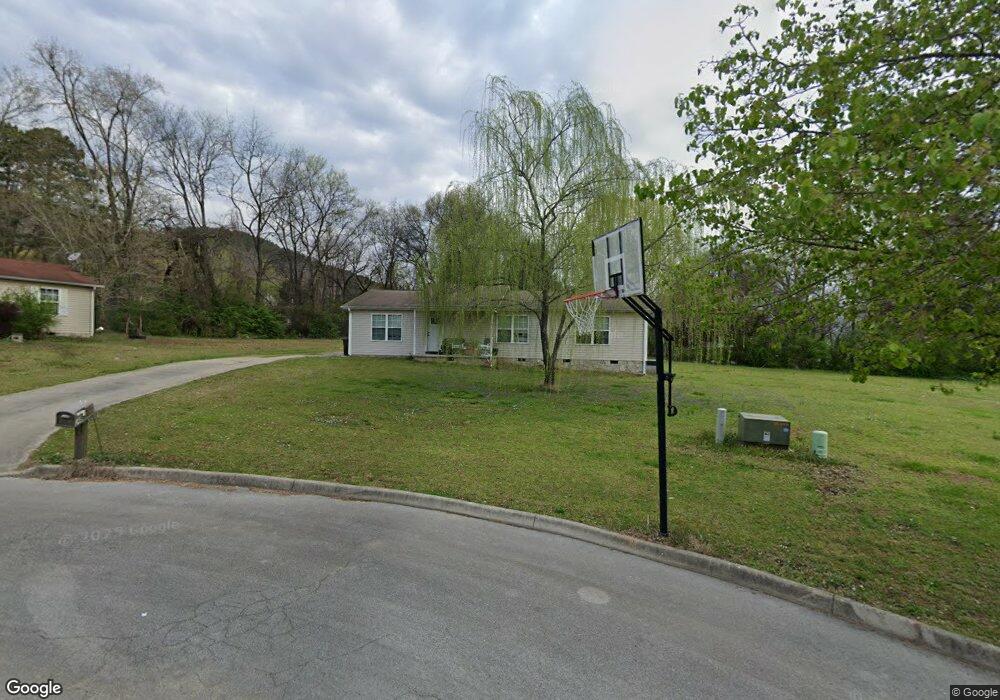
148 Hiram Green Ln Dayton, TN 37321
Estimated Value: $227,000 - $285,000
3
Beds
2
Baths
1,296
Sq Ft
$197/Sq Ft
Est. Value
About This Home
This home is located at 148 Hiram Green Ln, Dayton, TN 37321 and is currently estimated at $255,362, approximately $197 per square foot. 148 Hiram Green Ln is a home located in Rhea County with nearby schools including Dayton City Elementary School, Rhea County Academy, and Calvary Baptist School.
Ownership History
Date
Name
Owned For
Owner Type
Purchase Details
Closed on
Jul 16, 2021
Sold by
Goins Timothy C
Bought by
Benton Jacob David and Graham Charity
Current Estimated Value
Home Financials for this Owner
Home Financials are based on the most recent Mortgage that was taken out on this home.
Original Mortgage
$176,767
Outstanding Balance
$160,535
Interest Rate
2.96%
Mortgage Type
New Conventional
Estimated Equity
$94,827
Purchase Details
Closed on
Apr 9, 2019
Sold by
Daniel Barry D and Daniel Heather
Bought by
Goins Timothy C
Home Financials for this Owner
Home Financials are based on the most recent Mortgage that was taken out on this home.
Original Mortgage
$117,826
Interest Rate
4.3%
Mortgage Type
FHA
Purchase Details
Closed on
Jul 25, 2007
Bought by
Daniel Barry D
Purchase Details
Closed on
Apr 2, 2007
Bought by
Pam Hixson
Purchase Details
Closed on
Apr 9, 1998
Bought by
Green Robert Hiram
Create a Home Valuation Report for This Property
The Home Valuation Report is an in-depth analysis detailing your home's value as well as a comparison with similar homes in the area
Home Values in the Area
Average Home Value in this Area
Purchase History
| Date | Buyer | Sale Price | Title Company |
|---|---|---|---|
| Benton Jacob David | $175,000 | Bridge City Ttl East Brainer | |
| Goins Timothy C | $120,000 | Title Insurance Company | |
| Daniel Barry D | $75,000 | -- | |
| Pam Hixson | $10,000 | -- | |
| Green Robert Hiram | $64,000 | -- |
Source: Public Records
Mortgage History
| Date | Status | Borrower | Loan Amount |
|---|---|---|---|
| Open | Benton Jacob David | $176,767 | |
| Previous Owner | Goins Timothy C | $117,826 |
Source: Public Records
Tax History Compared to Growth
Tax History
| Year | Tax Paid | Tax Assessment Tax Assessment Total Assessment is a certain percentage of the fair market value that is determined by local assessors to be the total taxable value of land and additions on the property. | Land | Improvement |
|---|---|---|---|---|
| 2024 | -- | $45,725 | $8,375 | $37,350 |
| 2023 | $863 | $28,000 | $3,525 | $24,475 |
| 2022 | $793 | $28,000 | $3,525 | $24,475 |
| 2021 | $794 | $28,000 | $3,525 | $24,475 |
| 2020 | $631 | $28,000 | $3,525 | $24,475 |
| 2019 | $792 | $28,000 | $3,525 | $24,475 |
| 2018 | $719 | $25,375 | $3,025 | $22,350 |
| 2017 | $694 | $25,375 | $3,025 | $22,350 |
| 2016 | $675 | $25,175 | $3,025 | $22,150 |
| 2015 | $650 | $25,175 | $3,025 | $22,150 |
| 2014 | $528 | $25,175 | $3,025 | $22,150 |
| 2013 | -- | $25,175 | $3,025 | $22,150 |
Source: Public Records
Map
Nearby Homes
- 191 Magnolia Ave
- 190 Lilac Ave
- 134 Riddle St
- 251 Foothills Dr
- 0 Riddle St
- 64 Riddle St
- 209 Foothills Dr
- 385 Riddle St
- 475 Old Graysville Rd
- 154 Abigayle Way
- Hayden Plan at Byrd Farms
- Hanover Plan at Byrd Farms
- Cali Plan at Byrd Farms
- Salem Plan at Byrd Farms
- Belhaven Plan at Byrd Farms
- Penwell Plan at Byrd Farms
- 172 Abigayle Way
- 482 Oliver Cir
- 665 Railroad St
- 570 Market St
- 148 & 144 Hiram Green Ln
- 158 Hiram Green Ln
- 257 Magnolia Ave
- 130 Hiram Green Ln
- 21.55 acres Magnolia St
- 153 Hiram Green Ln
- 153 Hiram Green Ln Unit 15
- 21.55 Ac Magnolia Ave
- 21.55 acre Magnolia Ave
- 273 Magnolia Ave
- 141 Hiram Green Ln
- 227 Magnolia Ave
- 148144 Hiram Green Ln
- 165 Jess A Green Ln
- 275 Magnolia Ave
- 310 Magnolia Ave
- 236 Sequoia St
- 170 Orchid Ave
- 234 Magnolia Ave
- 256 Sequoia St