Estimated Value: $699,129
7
Beds
7
Baths
5,300
Sq Ft
$132/Sq Ft
Est. Value
About This Home
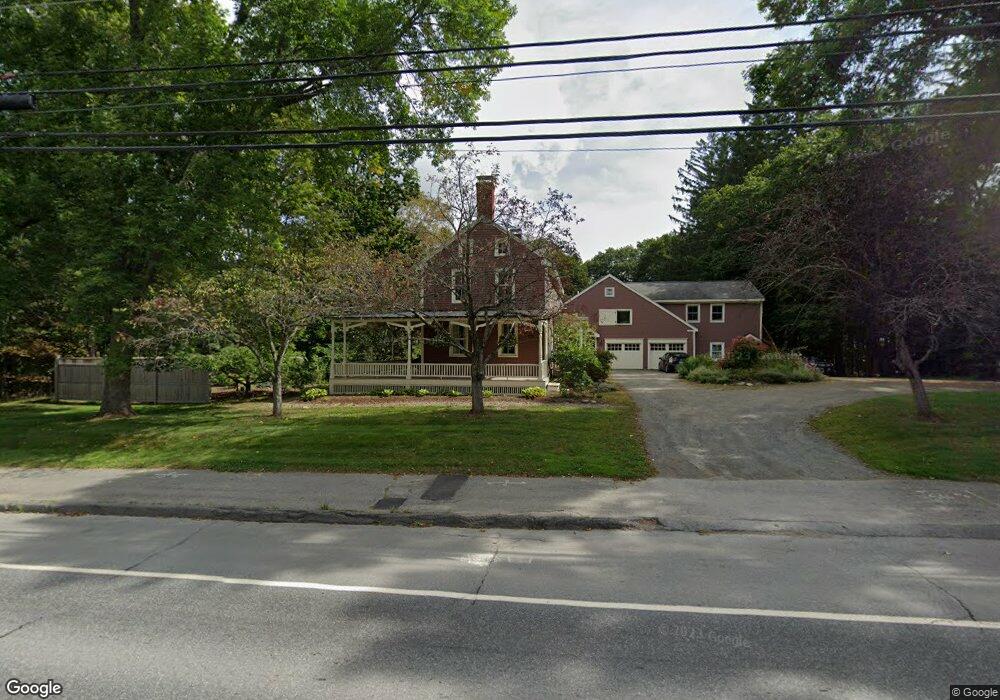
This home is located at 148 Main St, Orono, ME 04473 and is currently estimated at $699,129, approximately $131 per square foot. 148 Main St is a home located in Penobscot County with nearby schools including Orono Middle School and Orono High School.
Ownership History
Date
Name
Owned For
Owner Type
Purchase Details
Closed on
Mar 24, 2009
Sold by
Liquidation Props Inc
Bought by
Rahill Brian A and Rahill Allan Elizabeth
Current Estimated Value
Home Financials for this Owner
Home Financials are based on the most recent Mortgage that was taken out on this home.
Original Mortgage
$276,000
Outstanding Balance
$175,106
Interest Rate
5.25%
Mortgage Type
Commercial
Estimated Equity
$524,023
Purchase Details
Closed on
May 17, 2005
Sold by
Bruce Dennis A and Bruce Jennifer A
Bought by
Haskell Matthew B
Create a Home Valuation Report for This Property
The Home Valuation Report is an in-depth analysis detailing your home's value as well as a comparison with similar homes in the area
Home Values in the Area
Average Home Value in this Area
Purchase History
| Date | Buyer | Sale Price | Title Company |
|---|---|---|---|
| Rahill Brian A | -- | -- | |
| Rahill Brian A | -- | -- | |
| Haskell Matthew B | -- | -- | |
| Haskell Matthew B | -- | -- | |
| Haskell Matthew B | -- | -- |
Source: Public Records
Mortgage History
| Date | Status | Borrower | Loan Amount |
|---|---|---|---|
| Open | Haskell Matthew B | $276,000 | |
| Closed | Haskell Matthew B | $34,500 | |
| Closed | Haskell Matthew B | $276,000 |
Source: Public Records
Tax History Compared to Growth
Tax History
| Year | Tax Paid | Tax Assessment Tax Assessment Total Assessment is a certain percentage of the fair market value that is determined by local assessors to be the total taxable value of land and additions on the property. | Land | Improvement |
|---|---|---|---|---|
| 2024 | $10,615 | $497,200 | $76,400 | $420,800 |
| 2023 | $10,577 | $452,000 | $69,500 | $382,500 |
| 2022 | $10,660 | $447,900 | $69,500 | $378,400 |
| 2021 | $10,638 | $447,900 | $69,500 | $378,400 |
| 2020 | $12,037 | $428,500 | $61,000 | $367,500 |
| 2019 | $11,334 | $428,500 | $61,000 | $367,500 |
| 2018 | $11,570 | $428,500 | $61,000 | $367,500 |
| 2017 | $11,141 | $428,500 | $61,000 | $367,500 |
| 2016 | $10,648 | $428,500 | $61,000 | $367,500 |
| 2015 | $10,455 | $428,500 | $61,000 | $367,500 |
| 2014 | $10,220 | $428,500 | $61,000 | $367,500 |
| 2013 | $9,941 | $428,500 | $61,000 | $367,500 |
Source: Public Records
Map
Nearby Homes