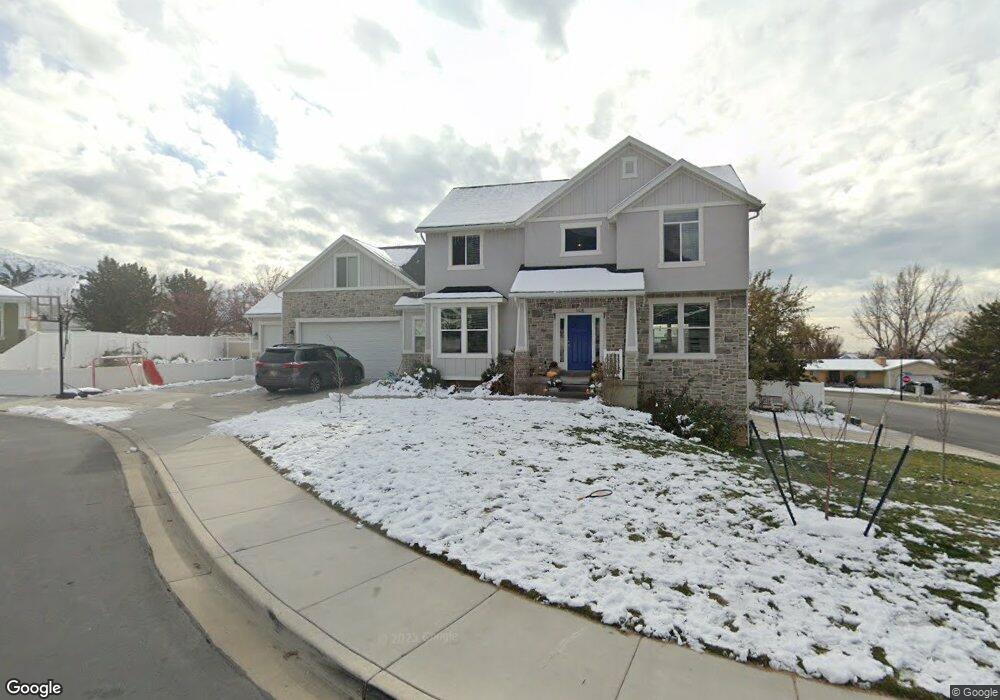
148 N 950 E Pleasant Grove, UT 84062
Estimated Value: $828,000 - $899,000
3
Beds
3
Baths
3,842
Sq Ft
$226/Sq Ft
Est. Value
About This Home
This home is located at 148 N 950 E, Pleasant Grove, UT 84062 and is currently estimated at $867,628, approximately $225 per square foot. 148 N 950 E is a home located in Utah County with nearby schools including Grovecrest Elementary School, Pleasant Grove Junior High School, and Pleasant Grove High School.
Ownership History
Date
Name
Owned For
Owner Type
Purchase Details
Closed on
May 30, 2017
Sold by
Ley Isaac R
Bought by
Ley Isaac R and Ley Allyson G
Current Estimated Value
Home Financials for this Owner
Home Financials are based on the most recent Mortgage that was taken out on this home.
Original Mortgage
$282,035
Outstanding Balance
$234,272
Interest Rate
3.97%
Mortgage Type
New Conventional
Estimated Equity
$633,356
Purchase Details
Closed on
Sep 9, 2016
Sold by
Monson Acres Subdivision Llc
Bought by
Millcreek Homes Inc
Home Financials for this Owner
Home Financials are based on the most recent Mortgage that was taken out on this home.
Original Mortgage
$231,453
Interest Rate
3.43%
Mortgage Type
Construction
Purchase Details
Closed on
Sep 6, 2016
Sold by
Millcreek Homes Inc
Bought by
Monson Acres Subdivision Llc
Home Financials for this Owner
Home Financials are based on the most recent Mortgage that was taken out on this home.
Original Mortgage
$231,453
Interest Rate
3.43%
Mortgage Type
Construction
Create a Home Valuation Report for This Property
The Home Valuation Report is an in-depth analysis detailing your home's value as well as a comparison with similar homes in the area
Home Values in the Area
Average Home Value in this Area
Purchase History
| Date | Buyer | Sale Price | Title Company |
|---|---|---|---|
| Ley Isaac R | -- | First American Title | |
| Ley Isaac R | -- | Vangurad Title Uns Ag | |
| Millcreek Homes Inc | -- | Gt Title Services | |
| Monson Acres Subdivision Llc | -- | Accommodation |
Source: Public Records
Mortgage History
| Date | Status | Borrower | Loan Amount |
|---|---|---|---|
| Open | Ley Isaac R | $282,035 | |
| Previous Owner | Millcreek Homes Inc | $231,453 |
Source: Public Records
Tax History
| Year | Tax Paid | Tax Assessment Tax Assessment Total Assessment is a certain percentage of the fair market value that is determined by local assessors to be the total taxable value of land and additions on the property. | Land | Improvement |
|---|---|---|---|---|
| 2025 | $3,615 | $462,220 | -- | -- |
| 2024 | $3,615 | $421,850 | $0 | $0 |
| 2023 | $3,427 | $418,715 | $0 | $0 |
| 2022 | $3,444 | $418,660 | $0 | $0 |
| 2021 | $3,069 | $568,000 | $169,100 | $398,900 |
| 2020 | $2,977 | $540,200 | $156,600 | $383,600 |
| 2019 | $2,614 | $490,500 | $149,300 | $341,200 |
| 2018 | $2,346 | $416,200 | $134,700 | $281,500 |
| 2017 | $2,230 | $210,650 | $0 | $0 |
| 2016 | $919 | $83,800 | $0 | $0 |
Source: Public Records
Map
Nearby Homes
Your Personal Tour Guide
Ask me questions while you tour the home.