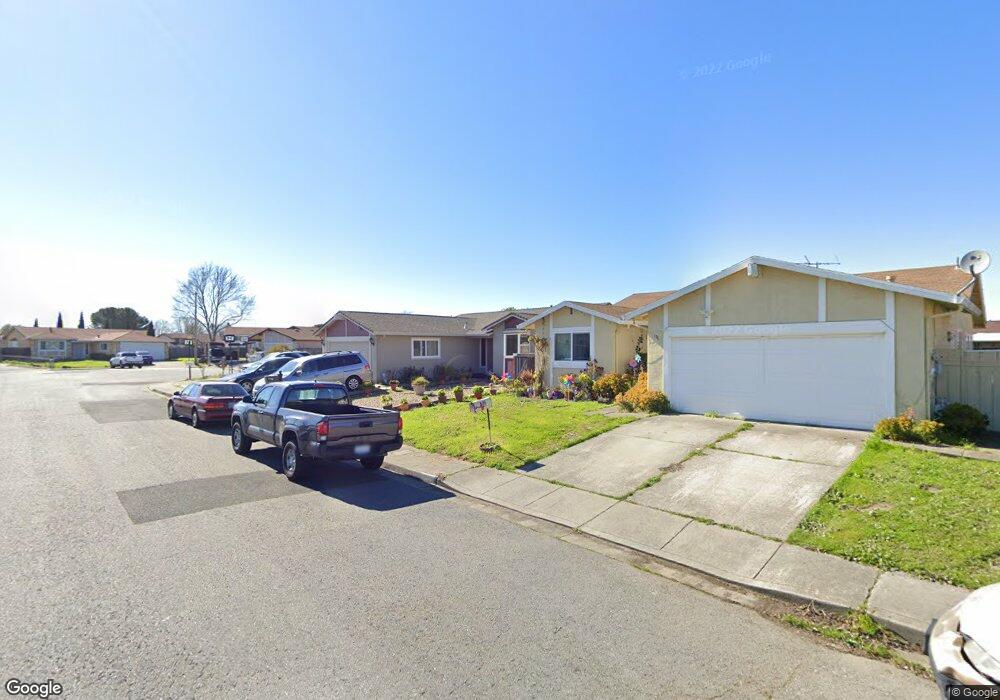
148 Pioneer Ct Vallejo, CA 94589
North Vallejo NeighborhoodEstimated Value: $463,635 - $609,000
3
Beds
2
Baths
1,344
Sq Ft
$393/Sq Ft
Est. Value
About This Home
This home is located at 148 Pioneer Ct, Vallejo, CA 94589 and is currently estimated at $528,409, approximately $393 per square foot. 148 Pioneer Ct is a home located in Solano County with nearby schools including Dan Mini Elementary School, Solano Middle School, and Vallejo High School.
Ownership History
Date
Name
Owned For
Owner Type
Purchase Details
Closed on
Mar 10, 2017
Sold by
Palompo Rogelio C and Palompo Agustina P
Bought by
Palompo Rogelio C and Palompo Agustina P
Current Estimated Value
Purchase Details
Closed on
Mar 23, 2006
Sold by
North Village Development Inc
Bought by
Galang Julio I and Galang Aurora R
Home Financials for this Owner
Home Financials are based on the most recent Mortgage that was taken out on this home.
Original Mortgage
$636,088
Outstanding Balance
$381,983
Interest Rate
7.25%
Mortgage Type
Balloon
Estimated Equity
$146,426
Create a Home Valuation Report for This Property
The Home Valuation Report is an in-depth analysis detailing your home's value as well as a comparison with similar homes in the area
Home Values in the Area
Average Home Value in this Area
Purchase History
| Date | Buyer | Sale Price | Title Company |
|---|---|---|---|
| Palompo Rogelio C | -- | None Available | |
| Galang Julio I | $848,500 | Frontier Title Company |
Source: Public Records
Mortgage History
| Date | Status | Borrower | Loan Amount |
|---|---|---|---|
| Open | Galang Julio I | $636,088 |
Source: Public Records
Tax History Compared to Growth
Tax History
| Year | Tax Paid | Tax Assessment Tax Assessment Total Assessment is a certain percentage of the fair market value that is determined by local assessors to be the total taxable value of land and additions on the property. | Land | Improvement |
|---|---|---|---|---|
| 2025 | $2,471 | $132,551 | $35,524 | $97,027 |
| 2024 | $2,471 | $129,953 | $34,828 | $95,125 |
| 2023 | $2,282 | $127,406 | $34,146 | $93,260 |
| 2022 | $2,172 | $124,909 | $33,477 | $91,432 |
| 2021 | $2,119 | $122,461 | $32,821 | $89,640 |
| 2020 | $2,107 | $121,206 | $32,485 | $88,721 |
| 2019 | $2,020 | $118,831 | $31,849 | $86,982 |
| 2018 | $1,873 | $116,502 | $31,225 | $85,277 |
| 2017 | $1,766 | $114,218 | $30,613 | $83,605 |
| 2016 | $1,194 | $111,979 | $30,013 | $81,966 |
| 2015 | $1,177 | $110,298 | $29,563 | $80,735 |
| 2014 | $1,159 | $108,138 | $28,984 | $79,154 |
Source: Public Records
Map
Nearby Homes
- 149 Drytown Ct
- 121 Yankee Jim Ct
- 289 Catalina Way
- 1634 Severus Dr
- 115 Kilty Ct
- 1863 Mini Dr
- 160 Shari Ct
- 140 Boggs Ct
- 141 Albatrosse Way
- 316 Meadows Dr
- 442 Northrup Ln
- 485 Avalon Cir
- 205 Marla Dr
- 2117 Elliott Dr
- 2041 Severus Dr
- 177 Brophy St
- 240 Rinaldo Dr
- 111 Spencer St
- 706 Capra Dr
- 121 Forsythia Ct