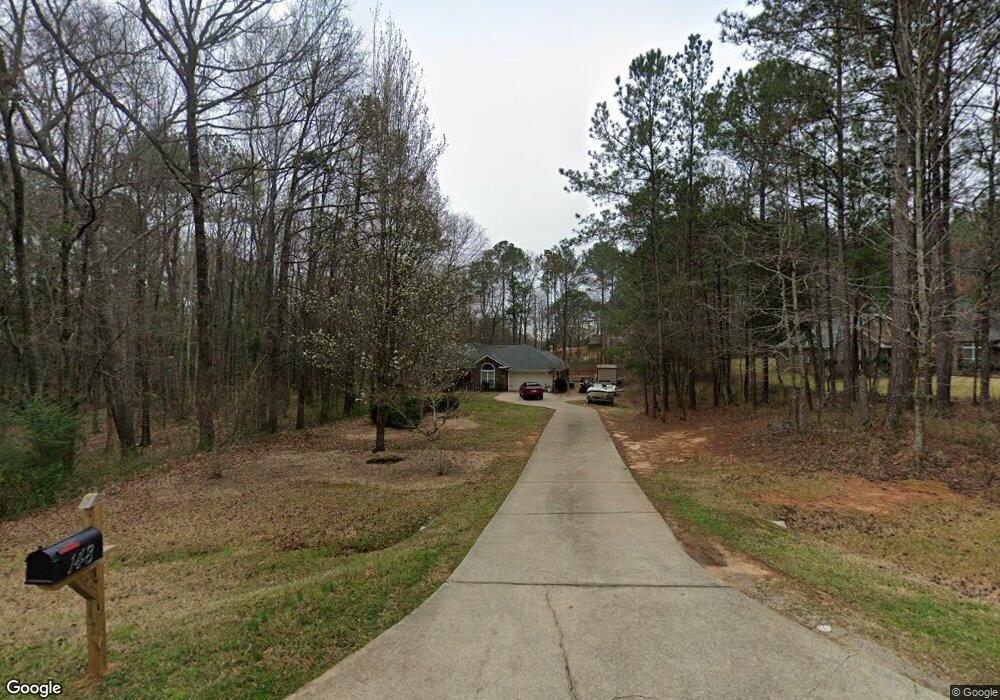
148 S Windsong Ct Cataula, GA 31804
Estimated Value: $350,000 - $419,000
4
Beds
3
Baths
2,265
Sq Ft
$168/Sq Ft
Est. Value
About This Home
This home is located at 148 S Windsong Ct, Cataula, GA 31804 and is currently estimated at $379,980, approximately $167 per square foot. 148 S Windsong Ct is a home located in Harris County with nearby schools including Mulberry Creek Elementary School, Harris County Carver Middle School, and Harris County High School.
Ownership History
Date
Name
Owned For
Owner Type
Purchase Details
Closed on
Jan 4, 2013
Sold by
Peterson Glenn A
Bought by
Watson Christopher J
Current Estimated Value
Home Financials for this Owner
Home Financials are based on the most recent Mortgage that was taken out on this home.
Original Mortgage
$235,714
Outstanding Balance
$163,739
Interest Rate
3.35%
Mortgage Type
New Conventional
Estimated Equity
$216,241
Purchase Details
Closed on
Aug 7, 2009
Sold by
Grayhawk Homes Inc
Bought by
Peterson Glenn A and Peterson Jessica A
Home Financials for this Owner
Home Financials are based on the most recent Mortgage that was taken out on this home.
Original Mortgage
$233,900
Interest Rate
5.19%
Mortgage Type
VA
Create a Home Valuation Report for This Property
The Home Valuation Report is an in-depth analysis detailing your home's value as well as a comparison with similar homes in the area
Home Values in the Area
Average Home Value in this Area
Purchase History
| Date | Buyer | Sale Price | Title Company |
|---|---|---|---|
| Watson Christopher J | $231,000 | -- | |
| Peterson Glenn A | $229,000 | -- | |
| Grayhawk Homes Inc | -- | -- |
Source: Public Records
Mortgage History
| Date | Status | Borrower | Loan Amount |
|---|---|---|---|
| Open | Watson Christopher J | $235,714 | |
| Previous Owner | Grayhawk Homes Inc | $233,900 |
Source: Public Records
Tax History Compared to Growth
Tax History
| Year | Tax Paid | Tax Assessment Tax Assessment Total Assessment is a certain percentage of the fair market value that is determined by local assessors to be the total taxable value of land and additions on the property. | Land | Improvement |
|---|---|---|---|---|
| 2024 | $3,146 | $116,394 | $12,000 | $104,394 |
| 2023 | $2,320 | $102,696 | $12,000 | $90,696 |
| 2022 | $2,781 | $102,696 | $12,000 | $90,696 |
| 2021 | $2,722 | $96,930 | $12,000 | $84,930 |
| 2020 | $2,626 | $93,477 | $12,000 | $81,477 |
| 2019 | $2,533 | $93,477 | $12,000 | $81,477 |
| 2018 | $2,491 | $90,025 | $12,000 | $78,025 |
| 2017 | $2,492 | $90,025 | $12,000 | $78,025 |
| 2016 | $2,189 | $86,477 | $12,000 | $74,477 |
| 2015 | $2,193 | $86,477 | $12,000 | $74,477 |
| 2014 | $2,197 | $86,477 | $12,000 | $74,477 |
| 2013 | -- | $86,476 | $12,000 | $74,476 |
Source: Public Records
Map
Nearby Homes
- 1278 Jones Rd
- 921 Grey Smoke Trail
- 249 Serenity Loop
- 218 E East Bonacre Rd
- 2495 Fortson Rd
- Lot 86 Hawkeye Trail Unit 86
- 78 Mitchell's Rest Unit 62
- 78 Mitchell's Rest
- Lot 86 Hawkeye Trail
- 104 Spruce Dr
- 53 E Scotch Ct
- 508 Sweetwater Dr
- 509 Sweetwater Dr
- 511 Sweetwater Dr
- 431 Quail Trail
- 172-6 Almond Ridge Dr
- 95 Sweetwater Ct
- 3860 Essex Heights Trail
- 654 Grey Rock Rd
- 72 Mountain Lake Ct
- 94 S Windsong Ct
- 198 Shenandoah Dr
- 176 S Windsong Ct
- 62 S Windsong Ct
- 202 Shenandoah Dr
- 120 Shenandoah Dr
- 161 S Windsong Ct
- 131 S Windsong Ct
- 79 S Windsong Ct
- 125 Shenandoah Dr
- 335 Windsong Dr
- 303 Windsong Dr
- 51 S Windsong Ct
- 1429 Jones Rd
- 1465 Jones Rd
- 1401 Jones Rd
- 275 Windsong Dr
- 250 Shenandoah Dr
- 1493 Jones Rd
- 259 Shenandoah Dr