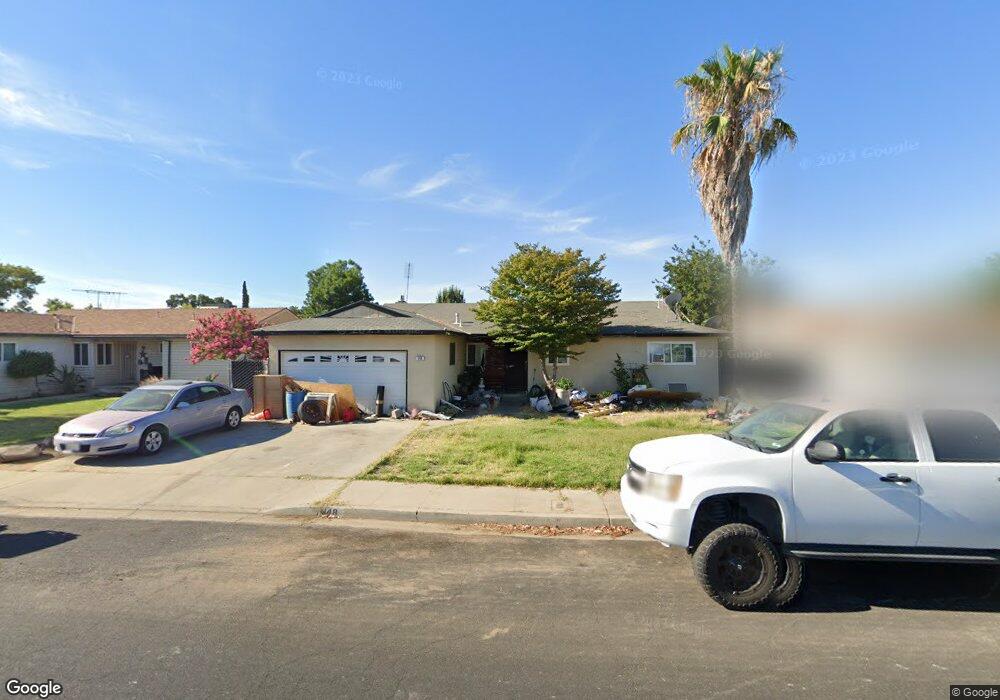
148 W Indianapolis Ave Clovis, CA 93612
Estimated Value: $369,000 - $400,000
3
Beds
2
Baths
1,522
Sq Ft
$251/Sq Ft
Est. Value
About This Home
This home is located at 148 W Indianapolis Ave, Clovis, CA 93612 and is currently estimated at $382,324, approximately $251 per square foot. 148 W Indianapolis Ave is a home located in Fresno County with nearby schools including Tarpey Elementary School, Alta Sierra Intermediate School, and Buchanan High School.
Ownership History
Date
Name
Owned For
Owner Type
Purchase Details
Closed on
Nov 3, 2011
Sold by
Allen Karyn Elaine and Songer Stephen Doss
Bought by
Rieffel Michael D and Rieffel Kathryn
Current Estimated Value
Home Financials for this Owner
Home Financials are based on the most recent Mortgage that was taken out on this home.
Original Mortgage
$121,831
Outstanding Balance
$83,380
Interest Rate
4.4%
Mortgage Type
FHA
Estimated Equity
$298,944
Purchase Details
Closed on
Apr 14, 2006
Sold by
Oglesby Kenneth and Oglesby Vicki
Bought by
Allen Karyn Elaine and Songer Stephen Doss
Home Financials for this Owner
Home Financials are based on the most recent Mortgage that was taken out on this home.
Original Mortgage
$299,000
Interest Rate
6.29%
Mortgage Type
Fannie Mae Freddie Mac
Purchase Details
Closed on
Mar 25, 1992
Sold by
Oglesby Vicki Lynn and Witham Vicki Lynn
Bought by
Oglesby Kenneth Dewayne and Oglesby Vicki Lynn
Create a Home Valuation Report for This Property
The Home Valuation Report is an in-depth analysis detailing your home's value as well as a comparison with similar homes in the area
Home Values in the Area
Average Home Value in this Area
Purchase History
| Date | Buyer | Sale Price | Title Company |
|---|---|---|---|
| Rieffel Michael D | $125,000 | Placer Title Company | |
| Allen Karyn Elaine | $299,000 | Fidelity National Title Co | |
| Oglesby Kenneth Dewayne | -- | -- |
Source: Public Records
Mortgage History
| Date | Status | Borrower | Loan Amount |
|---|---|---|---|
| Open | Rieffel Michael D | $121,831 | |
| Previous Owner | Allen Karyn Elaine | $299,000 |
Source: Public Records
Tax History
| Year | Tax Paid | Tax Assessment Tax Assessment Total Assessment is a certain percentage of the fair market value that is determined by local assessors to be the total taxable value of land and additions on the property. | Land | Improvement |
|---|---|---|---|---|
| 2025 | $1,866 | $156,993 | $47,095 | $109,898 |
| 2023 | $1,830 | $150,899 | $45,267 | $105,632 |
| 2022 | $1,772 | $147,941 | $44,380 | $103,561 |
| 2021 | $1,723 | $145,041 | $43,510 | $101,531 |
| 2020 | $1,716 | $143,554 | $43,064 | $100,490 |
| 2019 | $1,683 | $140,740 | $42,220 | $98,520 |
| 2018 | $1,646 | $137,982 | $41,393 | $96,589 |
| 2017 | $1,619 | $135,278 | $40,582 | $94,696 |
| 2016 | $1,564 | $132,627 | $39,787 | $92,840 |
| 2015 | $1,540 | $130,636 | $39,190 | $91,446 |
| 2014 | $1,512 | $128,078 | $38,423 | $89,655 |
Source: Public Records
Map
Nearby Homes
- 30 W Holland Ave
- 2984 Homsy Ave
- 332 W Indianapolis Ave
- 384 W Indianapolis Ave
- 30 W Swift Ave
- 36 Santa Ana Ave
- 424 W Rialto Ave
- 505 W Pico Ave
- 555 W Ashcroft Ave
- 5188 E Ashlan Ave Unit 128
- 546 W Swift Ave
- 2236 Peach Ave Unit 3
- 2236 Peach Ave Unit 4
- 521 W Ashlan Ave
- 531 W Ashlan Ave
- 5164 E Ashlan Ave Unit 131
- 541 W Ashlan Ave
- 431 W Alamos Ave Unit 4
- 621 W Pat Dr
- 5138 E Ashlan Ave Unit 101
- 158 W Indianapolis Ave
- 138 W Indianapolis Ave
- 149 W Ashcroft Ave
- 159 W Ashcroft Ave
- 168 W Indianapolis Ave
- 139 W Ashcroft Ave
- 128 W Indianapolis Ave
- 149 W Indianapolis Ave
- 169 W Ashcroft Ave
- 129 W Ashcroft Ave
- 159 W Indianapolis Ave
- 139 W Indianapolis Ave
- 178 W Indianapolis Ave
- 118 W Indianapolis Ave
- 169 W Indianapolis Ave
- 129 W Indianapolis Ave
- 179 W Ashcroft Ave
- 119 W Ashcroft Ave
- 179 W Indianapolis Ave
- 188 W Indianapolis Ave
Your Personal Tour Guide
Ask me questions while you tour the home.