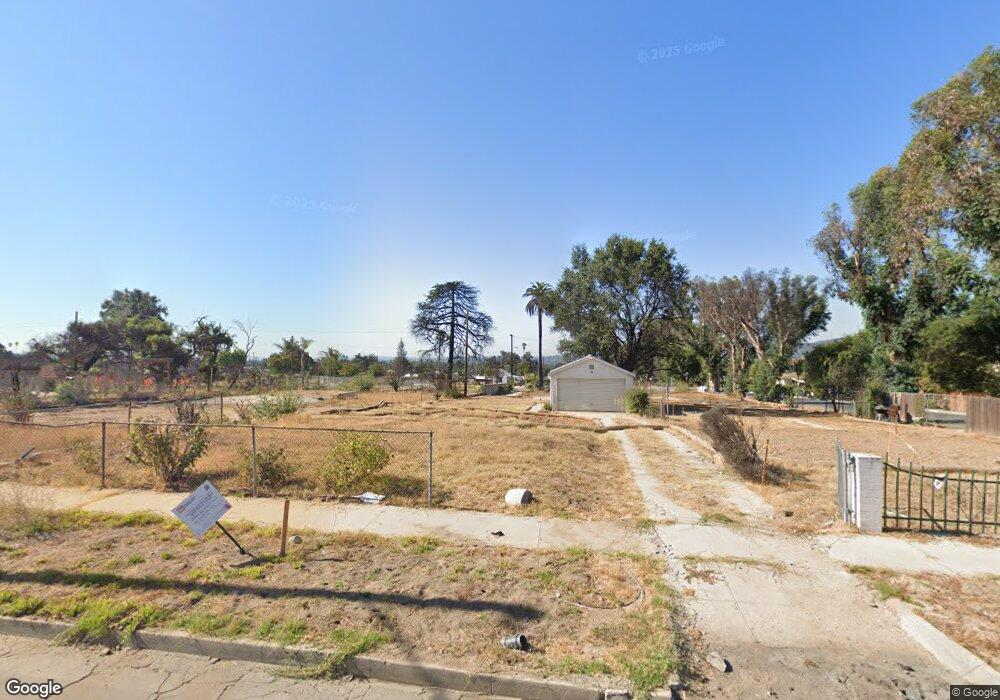
148 W Terrace St Altadena, CA 91001
Estimated Value: $376,000 - $876,543
2
Beds
1
Bath
1,010
Sq Ft
$573/Sq Ft
Est. Value
About This Home
This home is located at 148 W Terrace St, Altadena, CA 91001 and is currently estimated at $578,848, approximately $573 per square foot. 148 W Terrace St is a home located in Los Angeles County with nearby schools including Charles W. Eliot Arts Magnet Academy, John Muir High School, and Cleveland Elementary.
Ownership History
Date
Name
Owned For
Owner Type
Purchase Details
Closed on
Jan 24, 2003
Sold by
Mcdaniels Malaya Sharpe
Bought by
Mcdaniels Jacqueline
Current Estimated Value
Home Financials for this Owner
Home Financials are based on the most recent Mortgage that was taken out on this home.
Original Mortgage
$119,000
Outstanding Balance
$50,582
Interest Rate
5.97%
Estimated Equity
$528,266
Purchase Details
Closed on
Mar 19, 1996
Sold by
Mcdaniels Jacqueline
Bought by
Mcdaniels Jacqueline and Mcdaniels Malaya Sharpe
Purchase Details
Closed on
Aug 18, 1995
Sold by
Mcdaniels Jacuqline
Bought by
Mcdaniels Jacqueline
Home Financials for this Owner
Home Financials are based on the most recent Mortgage that was taken out on this home.
Original Mortgage
$81,500
Interest Rate
7.5%
Purchase Details
Closed on
Nov 22, 1993
Sold by
Mcdaniels Malaya Sharpe
Bought by
Mcdaniels Jacqueline
Create a Home Valuation Report for This Property
The Home Valuation Report is an in-depth analysis detailing your home's value as well as a comparison with similar homes in the area
Home Values in the Area
Average Home Value in this Area
Purchase History
| Date | Buyer | Sale Price | Title Company |
|---|---|---|---|
| Mcdaniels Jacqueline | -- | Gateway | |
| Mcdaniels Jacqueline | -- | -- | |
| Mcdaniels Jacqueline | -- | Chicago Title | |
| Mcdaniels Jacqueline | -- | -- |
Source: Public Records
Mortgage History
| Date | Status | Borrower | Loan Amount |
|---|---|---|---|
| Open | Mcdaniels Jacqueline | $119,000 | |
| Previous Owner | Mcdaniels Jacqueline | $81,500 |
Source: Public Records
Tax History
| Year | Tax Paid | Tax Assessment Tax Assessment Total Assessment is a certain percentage of the fair market value that is determined by local assessors to be the total taxable value of land and additions on the property. | Land | Improvement |
|---|---|---|---|---|
| 2025 | $1,903 | $41,056 | $41,056 | -- |
| 2024 | $1,903 | $124,262 | $61,924 | $62,338 |
| 2023 | $1,880 | $121,826 | $60,710 | $61,116 |
| 2022 | $1,821 | $119,438 | $59,520 | $59,918 |
| 2021 | $1,701 | $117,097 | $58,353 | $58,744 |
| 2019 | $1,645 | $113,625 | $56,623 | $57,002 |
| 2018 | $1,608 | $111,398 | $55,513 | $55,885 |
| 2016 | $1,545 | $107,074 | $53,358 | $53,716 |
| 2015 | $1,527 | $105,467 | $52,557 | $52,910 |
| 2014 | $1,509 | $103,402 | $51,528 | $51,874 |
Source: Public Records
Map
Nearby Homes
- 2941 Glenrose Ave
- 105 W Mariposa St
- 87 W Mariposa St
- 128 W Mendocino St
- 318 W Altadena Dr
- 2716 Mcnally Ave
- 27 W Palm St
- 419 W Altadena Dr
- 2641 Highview Ave
- 3183 Olive Ave
- 79 E Calaveras St
- 4 La Venezia Ct
- 70 W Las Flores Dr
- 2637 N Olive Ave
- 147 W Las Flores Dr
- 3010 Highview Ave
- 175 E Palm St
- 2415 Fair Oaks Ave
- 283 E Mariposa St
- 197 E Palm St
- 140 W Terrace St
- 156 W Terrace St
- 151 W Manor St
- 124 W Terrace St
- 159 W Manor St
- 159 W Manor St
- 133 W Manor St
- 174 W Terrace St
- 149 W Terrace St
- 175 W Terrace St
- 116 W Terrace St
- 143 W Terrace St
- 2936 Glenrose Ave
- 125 W Manor St
- 133 W Terrace St
- 184 W Terrace St
- 185 W Terrace St
- 108 W Terrace St
- 2879 Glenrose Ave
- 192 W Terrace St
Your Personal Tour Guide
Ask me questions while you tour the home.