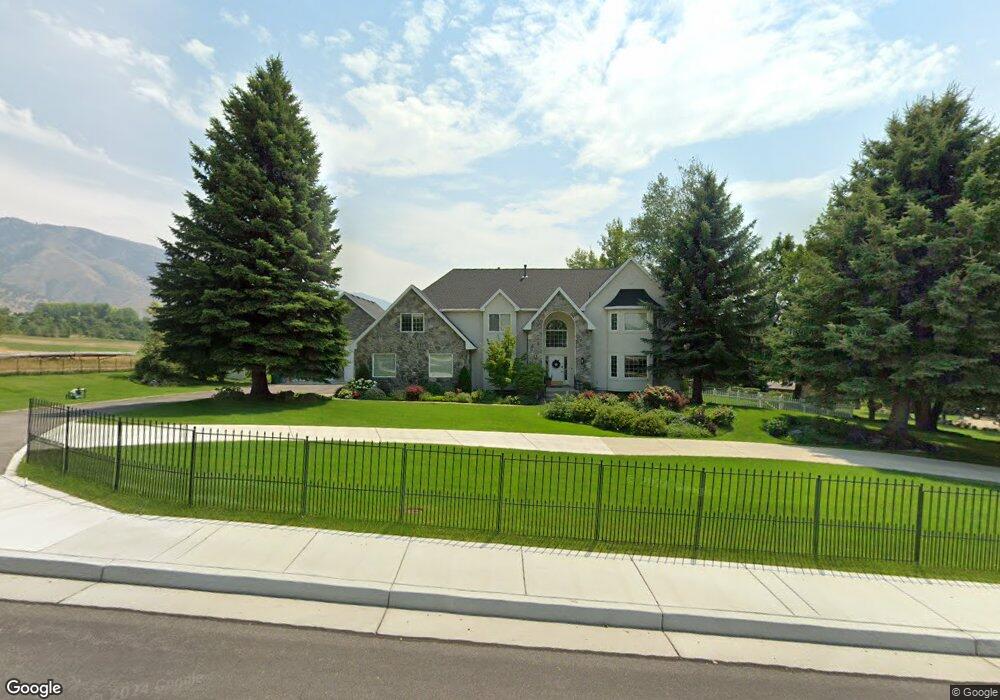
1480 E 3100 N North Logan, UT 84341
Estimated Value: $840,737 - $1,029,000
7
Beds
4
Baths
4,572
Sq Ft
$200/Sq Ft
Est. Value
About This Home
This home is located at 1480 E 3100 N, North Logan, UT 84341 and is currently estimated at $913,184, approximately $199 per square foot. 1480 E 3100 N is a home located in Cache County with nearby schools including North Park School, Cedar Ridge School, and Cedar Ridge Middle School.
Ownership History
Date
Name
Owned For
Owner Type
Purchase Details
Closed on
Jan 19, 2024
Sold by
Paul And Penny Morris Family Revocable T and Morris Penny
Bought by
Niemann Zachary and Niemann Savannah
Current Estimated Value
Home Financials for this Owner
Home Financials are based on the most recent Mortgage that was taken out on this home.
Original Mortgage
$596,000
Outstanding Balance
$584,632
Interest Rate
7.03%
Mortgage Type
New Conventional
Estimated Equity
$328,552
Purchase Details
Closed on
Aug 29, 2019
Sold by
Morris Paul and Morris Penny
Bought by
Paul And Penny Morris Frt
Purchase Details
Closed on
Feb 24, 2006
Sold by
Hellewell Lester Odell and Hellewell Kathleen M
Bought by
Morris Paul L and Morris Penny L
Home Financials for this Owner
Home Financials are based on the most recent Mortgage that was taken out on this home.
Original Mortgage
$303,000
Interest Rate
6.15%
Mortgage Type
New Conventional
Create a Home Valuation Report for This Property
The Home Valuation Report is an in-depth analysis detailing your home's value as well as a comparison with similar homes in the area
Home Values in the Area
Average Home Value in this Area
Purchase History
| Date | Buyer | Sale Price | Title Company |
|---|---|---|---|
| Niemann Zachary | -- | Us Title | |
| Paul And Penny Morris Frt | -- | None Available | |
| Morris Paul L | -- | Cache Title Company | |
| Hellewell Lester Odell | -- | Cache Title Company |
Source: Public Records
Mortgage History
| Date | Status | Borrower | Loan Amount |
|---|---|---|---|
| Open | Niemann Zachary | $596,000 | |
| Previous Owner | Morris Paul L | $303,000 |
Source: Public Records
Tax History Compared to Growth
Tax History
| Year | Tax Paid | Tax Assessment Tax Assessment Total Assessment is a certain percentage of the fair market value that is determined by local assessors to be the total taxable value of land and additions on the property. | Land | Improvement |
|---|---|---|---|---|
| 2025 | $3,375 | $472,365 | $0 | $0 |
| 2024 | $3,285 | $427,880 | $0 | $0 |
| 2023 | $3,460 | $421,755 | $0 | $0 |
| 2022 | $3,621 | $421,750 | $0 | $0 |
| 2021 | $3,513 | $634,420 | $104,800 | $529,620 |
| 2020 | $3,131 | $530,219 | $104,800 | $425,419 |
| 2019 | $3,373 | $530,219 | $104,800 | $425,419 |
| 2018 | $3,055 | $478,930 | $109,000 | $369,930 |
| 2017 | $2,968 | $244,915 | $0 | $0 |
| 2016 | $3,014 | $244,915 | $0 | $0 |
| 2015 | $2,744 | $222,135 | $0 | $0 |
| 2014 | $2,679 | $222,135 | $0 | $0 |
| 2013 | -- | $207,725 | $0 | $0 |
Source: Public Records
Map
Nearby Homes
- 105 E 3100 N
- 3082 N 1800 E
- Lincoln Plan at Lone Cedar
- Westbrook Plan at Lone Cedar
- Scottsford Plan at Lone Cedar
- Edgeworth Plan at Lone Cedar
- Brantwood Plan at Lone Cedar
- Vanbrough Plan at Lone Cedar
- Canyon Plan at Lone Cedar
- Jefferson Plan at Lone Cedar
- Chamberlain Plan at Lone Cedar
- Hamilton Plan at Lone Cedar
- Kensington Plan at Lone Cedar
- Huntington Plan at Lone Cedar
- Stanton Plan at Lone Cedar
- Ravenstone Plan at Lone Cedar
- Crimson Plan at Lone Cedar
- Cedar Ridge Plan at Lone Cedar
- Denford Plan at Lone Cedar
- Monroe Plan at Lone Cedar
- 3105 N 1400 E
- 3080 N 1400 E
- 3120 N 1450 E
- 3042 N 1400 E
- 3134 N 1450 E
- 3142 N 1400 E
- 1384 E 3100 N
- 3004 N 1400 E
- 3041 N 1400 E Unit 13
- 3021 N 1400 E
- 3180 N 1450 E
- 3169 N 1450 E
- 1358 E 3100 N
- 1755 E 3100 N Unit 7
- 2966 N 1400 E
- 1165 E 3100 N Unit 6
- 1375 E 3100 N
- 3001 N 1400 E Unit 15
- 3001 N 1400 E Unit 15
- 3193 N 1450 E