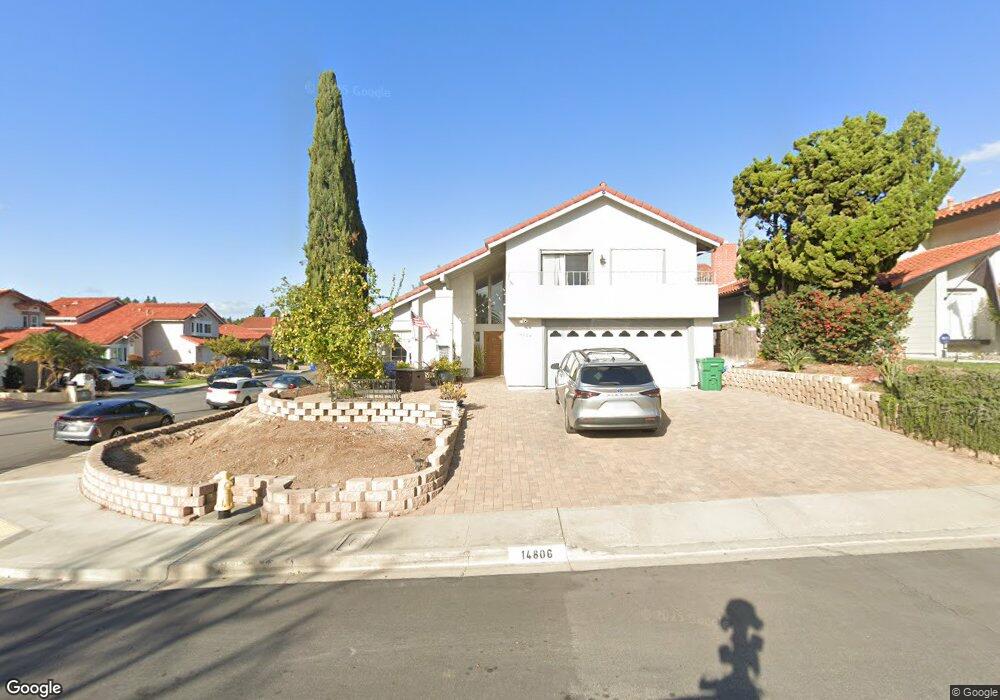
14806 Priscilla St San Diego, CA 92129
Rancho Peñasquitos NeighborhoodEstimated Value: $1,407,000 - $1,586,000
3
Beds
3
Baths
2,641
Sq Ft
$553/Sq Ft
Est. Value
About This Home
This home is located at 14806 Priscilla St, San Diego, CA 92129 and is currently estimated at $1,459,543, approximately $552 per square foot. 14806 Priscilla St is a home located in San Diego County with nearby schools including Rolling Hills Elementary School, Black Mountain Middle School, and Mt. Carmel High School.
Ownership History
Date
Name
Owned For
Owner Type
Purchase Details
Closed on
Mar 25, 2019
Sold by
Endreson Dale R and Endreson Sehnaz H
Bought by
Dale Roger Endreson and Dale Sehnaz Hanife
Current Estimated Value
Purchase Details
Closed on
Aug 21, 1996
Sold by
Taylor Eric H and Taylor Karen L
Bought by
Endreson Dale R and Endreson Sehnaz H
Home Financials for this Owner
Home Financials are based on the most recent Mortgage that was taken out on this home.
Original Mortgage
$200,000
Outstanding Balance
$15,838
Interest Rate
8.23%
Estimated Equity
$1,443,705
Purchase Details
Closed on
Nov 22, 1993
Sold by
Mcadams Charles F
Bought by
Taylor Eric H and Taylor Karen L
Home Financials for this Owner
Home Financials are based on the most recent Mortgage that was taken out on this home.
Original Mortgage
$179,200
Interest Rate
7.09%
Create a Home Valuation Report for This Property
The Home Valuation Report is an in-depth analysis detailing your home's value as well as a comparison with similar homes in the area
Home Values in the Area
Average Home Value in this Area
Purchase History
| Date | Buyer | Sale Price | Title Company |
|---|---|---|---|
| Dale Roger Endreson | -- | None Available | |
| Endreson Dale R | $223,000 | Continental Lawyers Title Co | |
| Taylor Eric H | $224,000 | Commonwealth Land Title Co |
Source: Public Records
Mortgage History
| Date | Status | Borrower | Loan Amount |
|---|---|---|---|
| Open | Endreson Dale R | $200,000 | |
| Previous Owner | Taylor Eric H | $179,200 |
Source: Public Records
Tax History Compared to Growth
Tax History
| Year | Tax Paid | Tax Assessment Tax Assessment Total Assessment is a certain percentage of the fair market value that is determined by local assessors to be the total taxable value of land and additions on the property. | Land | Improvement |
|---|---|---|---|---|
| 2025 | $3,989 | $363,169 | $74,834 | $288,335 |
| 2024 | $3,989 | $356,049 | $73,367 | $282,682 |
| 2023 | $3,901 | $349,069 | $71,929 | $277,140 |
| 2022 | $3,833 | $342,225 | $70,519 | $271,706 |
| 2021 | $3,781 | $335,516 | $69,137 | $266,379 |
| 2020 | $3,730 | $332,077 | $68,429 | $263,648 |
| 2019 | $3,632 | $325,567 | $67,088 | $258,479 |
| 2018 | $3,528 | $319,184 | $65,773 | $253,411 |
| 2017 | $3,432 | $312,927 | $64,484 | $248,443 |
| 2016 | $3,359 | $306,792 | $63,220 | $243,572 |
| 2015 | $3,309 | $302,185 | $62,271 | $239,914 |
| 2014 | $3,230 | $296,267 | $61,052 | $235,215 |
Source: Public Records
Map
Nearby Homes
- 14793 Penasquitos Dr
- 12555 Taylor Way
- Residence 2 Plan at Junipers - Woodlands
- Residence 1 Plan at Junipers - Lilac
- Residence 3 Plan at Junipers - Sycamore
- Residence 1 Plan at Junipers - Woodlands
- Residence 3 Plan at Junipers - Lilac
- Residence 2X Plan at Junipers - Lilac
- Residence 2 Plan at Junipers - Sycamore
- Residence 3 Plan at Junipers - Woodlands
- Residence 4 Plan at Junipers - Woodlands
- Residence 3X Plan at Junipers - Lilac
- Residence 2 Plan at Junipers - Lilac
- Residence 1 Plan at Junipers - Sycamore
- 12232 Allison Way
- 12566 Taylor Way
- 12582 Taylor Way
- 12475 Miranda Way
- 12576 Taylor Way
- 12251 Allison Way
- 14814 Priscilla St
- 14838 Priscilla St
- 14830 Priscilla St
- 14844 Priscilla St
- 14828 Satanas St
- 14820 Satanas St
- 14804 Satanas St
- 14836 Satanas St
- 14848 Priscilla St
- 14805 Priscilla St
- 14809 Priscilla St
- 14812 Satanas St
- 14844 Satanas St
- 14854 Priscilla St
- 14813 Priscilla St
- 14852 Satanas St
- 14819 Priscilla St
- 14823 Priscilla St
- 14860 Satanas St
- 14835 Priscilla St