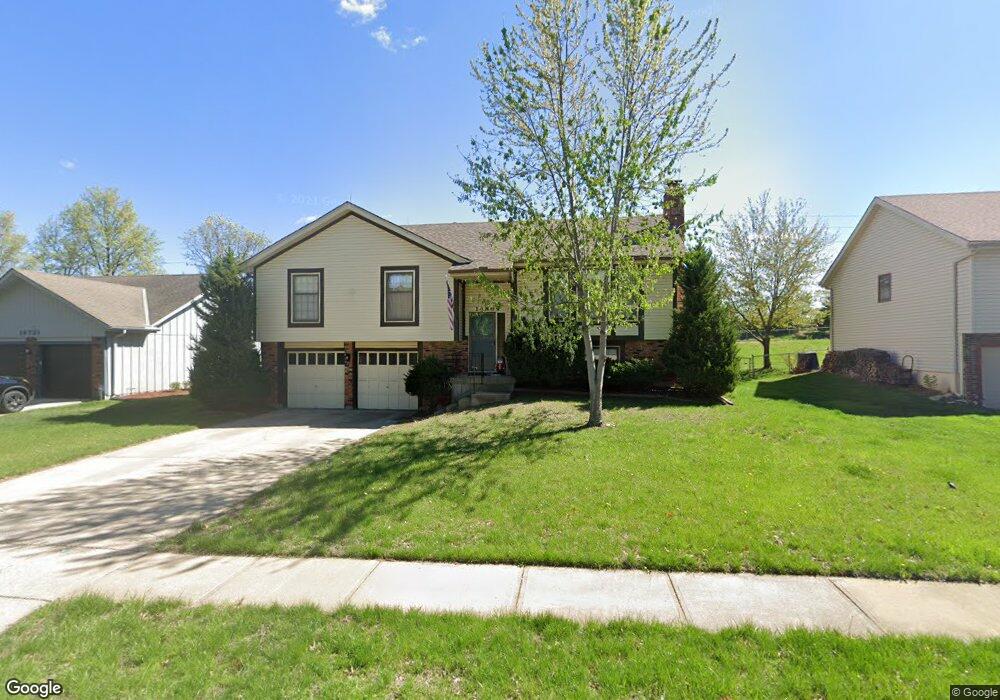
14809 W 94th Terrace Lenexa, KS 66215
Estimated Value: $343,000 - $386,000
4
Beds
3
Baths
1,194
Sq Ft
$307/Sq Ft
Est. Value
About This Home
This home is located at 14809 W 94th Terrace, Lenexa, KS 66215 and is currently estimated at $366,221, approximately $306 per square foot. 14809 W 94th Terrace is a home located in Johnson County with nearby schools including Sunflower Elementary School, Westridge Middle School, and Shawnee Mission West High School.
Ownership History
Date
Name
Owned For
Owner Type
Purchase Details
Closed on
Aug 6, 2024
Sold by
Min Kay Khine
Bought by
Khine Min Kay and Khine Alex Aye
Current Estimated Value
Purchase Details
Closed on
Aug 26, 2009
Sold by
Maxwell Richard A and Maxwell Patricia L
Bought by
Min Kay Khine
Home Financials for this Owner
Home Financials are based on the most recent Mortgage that was taken out on this home.
Original Mortgage
$158,083
Interest Rate
5.26%
Mortgage Type
FHA
Purchase Details
Closed on
Dec 8, 2006
Sold by
Drake Alana L and Drake Charles
Bought by
Maxwell Richard A and Maxwell Patricia L
Home Financials for this Owner
Home Financials are based on the most recent Mortgage that was taken out on this home.
Original Mortgage
$132,050
Interest Rate
6.2%
Mortgage Type
New Conventional
Create a Home Valuation Report for This Property
The Home Valuation Report is an in-depth analysis detailing your home's value as well as a comparison with similar homes in the area
Home Values in the Area
Average Home Value in this Area
Purchase History
| Date | Buyer | Sale Price | Title Company |
|---|---|---|---|
| Khine Min Kay | -- | None Listed On Document | |
| Min Kay Khine | -- | Alpha Title Llc | |
| Maxwell Richard A | -- | Old Republic Title Of Kansas |
Source: Public Records
Mortgage History
| Date | Status | Borrower | Loan Amount |
|---|---|---|---|
| Previous Owner | Min Kay Khine | $158,083 | |
| Previous Owner | Maxwell Richard A | $132,050 |
Source: Public Records
Tax History Compared to Growth
Tax History
| Year | Tax Paid | Tax Assessment Tax Assessment Total Assessment is a certain percentage of the fair market value that is determined by local assessors to be the total taxable value of land and additions on the property. | Land | Improvement |
|---|---|---|---|---|
| 2024 | $4,124 | $37,375 | $7,324 | $30,051 |
| 2023 | $4,071 | $36,144 | $7,324 | $28,820 |
| 2022 | $3,592 | $31,855 | $6,364 | $25,491 |
| 2021 | $3,592 | $30,176 | $5,055 | $25,121 |
| 2020 | $3,126 | $25,944 | $4,549 | $21,395 |
| 2019 | $2,933 | $24,300 | $3,792 | $20,508 |
| 2018 | $2,908 | $23,886 | $3,792 | $20,094 |
| 2017 | $2,648 | $21,045 | $3,257 | $17,788 |
| 2016 | $2,557 | $20,056 | $3,257 | $16,799 |
| 2015 | $2,458 | $19,401 | $3,257 | $16,144 |
| 2013 | -- | $18,481 | $3,257 | $15,224 |
Source: Public Records
Map
Nearby Homes
- 9318 Greenway Ln
- 9131 Darnell St
- 9202 Greenway Ln
- 15320 W 92nd Place
- 9207 Boehm Dr
- 8946 Country Hill Ct
- 9203 Boehm Dr
- 9029 Acuff Ln
- 15920 W 91st Terrace
- 8919 Greenway Ln
- 14101 W 88th Place
- 8641 Greenwood Ln
- 8616 Baska Ct
- 13312 W 91st St
- 15611 W 86th St
- 13017 W 92nd St
- 10184 Haskins St
- 14424 W 84th Terrace
- 17804 W 96th St
- 17806 W 96th St
- 14813 W 94th Terrace
- 14721 W 94th Terrace
- 14909 W 94th Terrace
- 14719 W 94th Terrace
- 14808 W 94th Terrace
- 14806 W 94th Terrace
- 14900 W 94th Terrace
- 14913 W 94th Terrace
- 14904 W 94th Terrace
- 14718 W 94th Terrace
- 14910 W 94th Terrace
- 14817 W 94th St
- 14807 W 94th St
- 15001 W 94th Terrace
- 14903 W 94th St
- 14801 W 94th St
- 9421 Alden St
- 9417 Alden St
- 14909 W 94th St
- 15002 W 94th Terrace