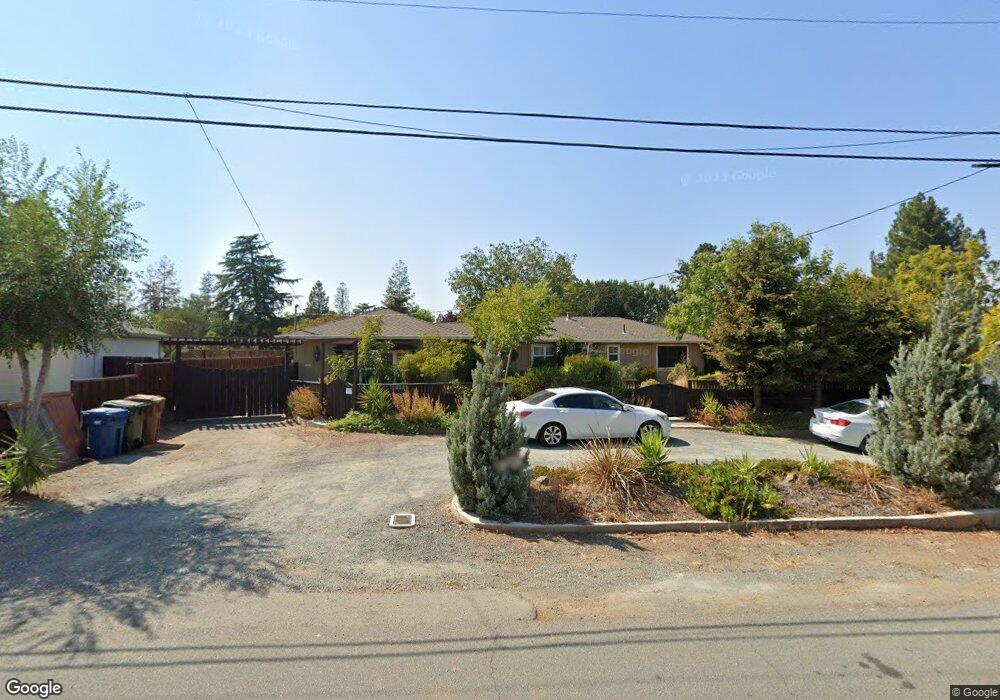
1481 Lydia Ln Clayton, CA 94517
Estimated Value: $945,187 - $1,067,000
3
Beds
2
Baths
1,690
Sq Ft
$586/Sq Ft
Est. Value
About This Home
This home is located at 1481 Lydia Ln, Clayton, CA 94517 and is currently estimated at $990,297, approximately $585 per square foot. 1481 Lydia Ln is a home located in Contra Costa County with nearby schools including Mt. Diablo Elementary School, Diablo View Middle School, and College Park High School.
Ownership History
Date
Name
Owned For
Owner Type
Purchase Details
Closed on
Nov 17, 2010
Sold by
Hery Jennifer and Odrzywolski Joseph M
Bought by
Baker Aaron S and Baker Kerry A
Current Estimated Value
Home Financials for this Owner
Home Financials are based on the most recent Mortgage that was taken out on this home.
Original Mortgage
$505,843
Outstanding Balance
$333,067
Interest Rate
4.23%
Mortgage Type
FHA
Estimated Equity
$657,230
Purchase Details
Closed on
Mar 2, 2001
Sold by
Carlson William A and Carlson Bonnie C
Bought by
Hery Jennifer and Odrzywolski Joseph M
Home Financials for this Owner
Home Financials are based on the most recent Mortgage that was taken out on this home.
Original Mortgage
$275,000
Interest Rate
7.12%
Mortgage Type
Purchase Money Mortgage
Create a Home Valuation Report for This Property
The Home Valuation Report is an in-depth analysis detailing your home's value as well as a comparison with similar homes in the area
Home Values in the Area
Average Home Value in this Area
Purchase History
| Date | Buyer | Sale Price | Title Company |
|---|---|---|---|
| Baker Aaron S | $519,000 | Chicago Title Company | |
| Hery Jennifer | $390,000 | Financial Title Company |
Source: Public Records
Mortgage History
| Date | Status | Borrower | Loan Amount |
|---|---|---|---|
| Open | Baker Aaron S | $505,843 | |
| Previous Owner | Hery Jennifer | $275,000 | |
| Closed | Hery Jennifer | $95,500 |
Source: Public Records
Tax History
| Year | Tax Paid | Tax Assessment Tax Assessment Total Assessment is a certain percentage of the fair market value that is determined by local assessors to be the total taxable value of land and additions on the property. | Land | Improvement |
|---|---|---|---|---|
| 2025 | $9,830 | $664,918 | $384,346 | $280,572 |
| 2024 | $9,533 | $651,881 | $376,810 | $275,071 |
| 2023 | $9,533 | $639,100 | $369,422 | $269,678 |
| 2022 | $9,460 | $626,570 | $362,179 | $264,391 |
| 2021 | $9,067 | $614,285 | $355,078 | $259,207 |
| 2019 | $8,911 | $596,068 | $344,548 | $251,520 |
| 2018 | $8,619 | $584,382 | $337,793 | $246,589 |
| 2017 | $8,371 | $572,924 | $331,170 | $241,754 |
| 2016 | $8,196 | $561,691 | $324,677 | $237,014 |
| 2015 | $8,138 | $553,255 | $319,801 | $233,454 |
| 2014 | $7,677 | $510,000 | $294,798 | $215,202 |
Source: Public Records
Map
Nearby Homes
- 50 Nottingham Place
- 5549 Pennsylvania Blvd
- 1833 Camino Estrada
- 5510 Alaska Dr
- 5549 Alabama Dr
- 35 Jalalon Place
- 5460 Concord Blvd Unit E4
- 57 Karkin Place
- 5492 Roundtree Dr Unit A
- 1505 Kirker Pass Rd Unit 122
- 1505 Kirker Pass Rd Unit 170
- 5817 Mitchell Canyon Ct
- 5450 Concord Blvd Unit M3
- 5500 Lewis Way
- 1640 Allegro Ave
- 5900 High St
- 5451 Roundtree Place
- 5450 Kirkwood Dr Unit H3
- 5333 Park Highlands Blvd Unit 27
- 5434 Roundtree Ct Unit A
- 1471 Lydia Ln
- 1491 Lydia Ln
- 5694 Clayton Rd
- 1450 Yosemite Cir
- 1461 Lydia Ln
- 1456 Yosemite Cir
- 1444 Yosemite Cir
- 1470 Lydia Ln
- 1462 Yosemite Cir
- 1438 Yosemite Cir
- 1451 Lydia Ln
- 2 Alef Ct
- 1451 Yosemite Cir
- 1445 Yosemite Cir
- 1468 Yosemite Cir
- 1432 Yosemite Cir
- 5720 Clayton Rd
- 8 Alef Ct
- 107 Hurd Place
- 1439 Yosemite Cir