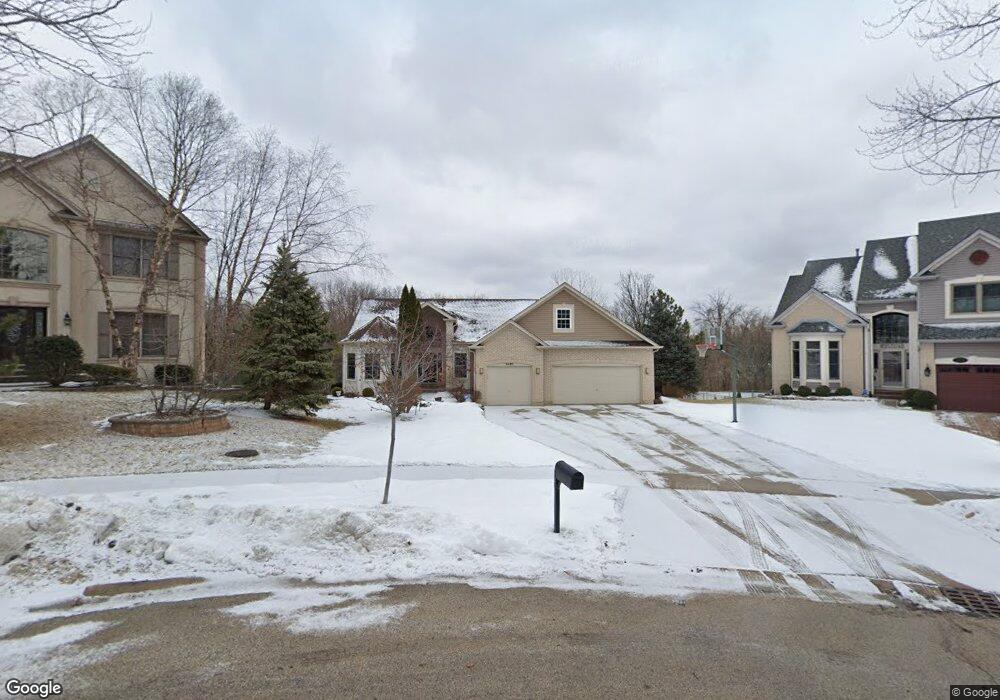
1481 Southridge Trail Algonquin, IL 60102
Estimated Value: $438,771 - $523,000
3
Beds
--
Bath
1,956
Sq Ft
$244/Sq Ft
Est. Value
About This Home
This home is located at 1481 Southridge Trail, Algonquin, IL 60102 and is currently estimated at $476,693, approximately $243 per square foot. 1481 Southridge Trail is a home located in Kane County with nearby schools including Dundee Middle School, West Prairie Middle School, and Harry D Jacobs High School.
Ownership History
Date
Name
Owned For
Owner Type
Purchase Details
Closed on
Sep 24, 2022
Sold by
Brzeski Swavek I and Brzeski Norella I
Bought by
Swavek I Brzeski Living Trust and Norella I Mendez-Brzeski Living Trust
Current Estimated Value
Purchase Details
Closed on
Jan 20, 2000
Sold by
Bhd Highlands Inc
Bought by
Brzeski Swaver I and Mendez Norella I
Home Financials for this Owner
Home Financials are based on the most recent Mortgage that was taken out on this home.
Original Mortgage
$248,400
Interest Rate
8.08%
Purchase Details
Closed on
May 17, 1997
Sold by
Pelock Jeffrey S
Bought by
Land Of Lincoln Conservation Inc
Create a Home Valuation Report for This Property
The Home Valuation Report is an in-depth analysis detailing your home's value as well as a comparison with similar homes in the area
Home Values in the Area
Average Home Value in this Area
Purchase History
| Date | Buyer | Sale Price | Title Company |
|---|---|---|---|
| Swavek I Brzeski Living Trust | -- | -- | |
| Brzeski Swaver I | $280,500 | Chicago Title Insurance Co | |
| Land Of Lincoln Conservation Inc | -- | Chicago Title Insurance Co |
Source: Public Records
Mortgage History
| Date | Status | Borrower | Loan Amount |
|---|---|---|---|
| Previous Owner | Brzeski Swaver I | $248,400 |
Source: Public Records
Tax History Compared to Growth
Tax History
| Year | Tax Paid | Tax Assessment Tax Assessment Total Assessment is a certain percentage of the fair market value that is determined by local assessors to be the total taxable value of land and additions on the property. | Land | Improvement |
|---|---|---|---|---|
| 2024 | $9,760 | $136,871 | $28,780 | $108,091 |
| 2023 | $9,266 | $123,152 | $25,895 | $97,257 |
| 2022 | $8,612 | $110,541 | $25,895 | $84,646 |
| 2021 | $8,349 | $104,373 | $24,450 | $79,923 |
| 2020 | $8,180 | $102,026 | $23,900 | $78,126 |
| 2019 | $7,775 | $96,854 | $22,688 | $74,166 |
| 2018 | $7,778 | $94,394 | $22,239 | $72,155 |
| 2017 | $7,450 | $88,302 | $20,804 | $67,498 |
| 2016 | $7,632 | $85,497 | $20,143 | $65,354 |
| 2015 | -- | $80,002 | $25,698 | $54,304 |
| 2014 | -- | $77,792 | $24,988 | $52,804 |
| 2013 | -- | $80,173 | $25,753 | $54,420 |
Source: Public Records
Map
Nearby Homes
- 35W788 Burr Oak Ln
- 18N732 Westhill Rd
- 3434 Blue Ridge Dr
- 3314 Blue Ridge Dr
- 1551 Westbourne Pkwy
- 1530 Westbourne Pkwy
- 1540 Westbourne Pkwy
- 3404 Green Pastures Rd
- 35W543 Miller Rd
- 3105 Shenandoah Dr
- 0000 State Route 31
- 2219 Barrett Dr
- 35W240 Crescent Dr
- 3835 Parsons Rd
- 1141 Waterford St
- 110 Newburgh Ln
- 2060 Dorchester Ave
- Adams Plan at Algonquin Meadows - Single Family
- Sequoia Plan at Algonquin Meadows - Single Family
- Bryce Plan at Algonquin Meadows - Single Family
- 1491 Southridge Trail
- 1470 Southridge Trail
- 1501 Southridge Trail
- 1480 Southridge Trail
- 1511 Southridge Trail
- 1500 Southridge Trail
- 18N702 Westhill Rd
- 1521 Southridge Trail
- 1520 Southridge Trail
- 1160 White Chapel Ln
- 1150 White Chapel Ln
- 35W773 Burr Oak Ln
- 1531 Southridge Trail
- 35W838 Burr Oak Ln
- 1530 Southridge Trail
- 400 N Randall Rd
- 1170 White Chapel Ln
- 1541 Southridge Trail
- 1401 Boulder Bluff Ln
- 35W862 Hollowside Dr