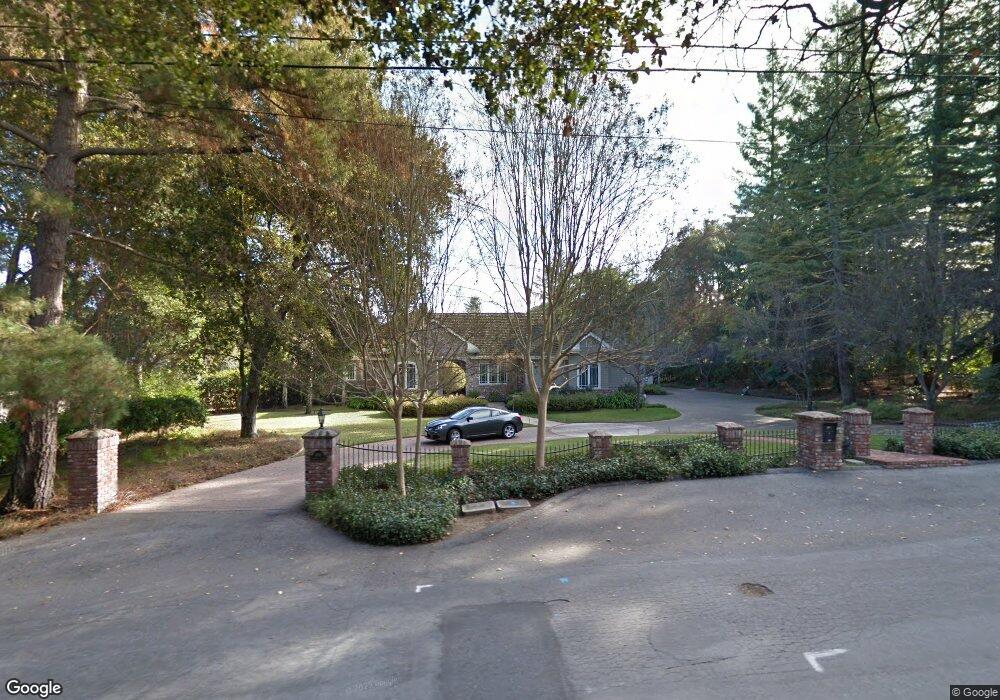
14810 Farwell Ave Saratoga, CA 95070
Fruitvale West NeighborhoodEstimated Value: $5,110,382 - $5,915,000
3
Beds
4
Baths
3,977
Sq Ft
$1,391/Sq Ft
Est. Value
About This Home
This home is located at 14810 Farwell Ave, Saratoga, CA 95070 and is currently estimated at $5,533,596, approximately $1,391 per square foot. 14810 Farwell Ave is a home located in Santa Clara County with nearby schools including Saratoga Elementary School, Foothill Elementary School, and Argonaut Elementary School.
Ownership History
Date
Name
Owned For
Owner Type
Purchase Details
Closed on
Nov 1, 2024
Sold by
Carter Family Trust and Carter Gene Pearce
Bought by
Carter Family Trust and Carter
Current Estimated Value
Purchase Details
Closed on
Jul 16, 1997
Sold by
Rosengarten Michael J
Bought by
Carter Gene Pearce and Carter Patricia Jo Ann
Home Financials for this Owner
Home Financials are based on the most recent Mortgage that was taken out on this home.
Original Mortgage
$123,700
Interest Rate
7.7%
Mortgage Type
Purchase Money Mortgage
Purchase Details
Closed on
May 16, 1996
Sold by
Rosengarten Deborah H
Bought by
Rosengarten Michael J
Home Financials for this Owner
Home Financials are based on the most recent Mortgage that was taken out on this home.
Original Mortgage
$720,000
Interest Rate
6.25%
Mortgage Type
Purchase Money Mortgage
Create a Home Valuation Report for This Property
The Home Valuation Report is an in-depth analysis detailing your home's value as well as a comparison with similar homes in the area
Home Values in the Area
Average Home Value in this Area
Purchase History
| Date | Buyer | Sale Price | Title Company |
|---|---|---|---|
| Carter Family Trust | -- | None Listed On Document | |
| Carter Gene Pearce | $1,050,000 | North American Title Co | |
| Rosengarten Michael J | -- | Stewart Title | |
| Rosengarten Michael J | $900,000 | Stewart Title |
Source: Public Records
Mortgage History
| Date | Status | Borrower | Loan Amount |
|---|---|---|---|
| Previous Owner | Carter Gene Pearce | $123,700 | |
| Previous Owner | Rosengarten Michael J | $720,000 |
Source: Public Records
Tax History Compared to Growth
Tax History
| Year | Tax Paid | Tax Assessment Tax Assessment Total Assessment is a certain percentage of the fair market value that is determined by local assessors to be the total taxable value of land and additions on the property. | Land | Improvement |
|---|---|---|---|---|
| 2025 | $31,972 | $2,733,363 | $1,596,769 | $1,136,594 |
| 2024 | $31,972 | $2,679,768 | $1,565,460 | $1,114,308 |
| 2023 | $31,686 | $2,627,224 | $1,534,765 | $1,092,459 |
| 2022 | $31,042 | $2,575,711 | $1,504,672 | $1,071,039 |
| 2021 | $30,542 | $2,525,208 | $1,475,169 | $1,050,039 |
| 2020 | $29,909 | $2,499,316 | $1,460,043 | $1,039,273 |
| 2019 | $29,411 | $2,450,311 | $1,431,415 | $1,018,896 |
| 2018 | $28,907 | $2,402,267 | $1,403,349 | $998,918 |
| 2017 | $28,808 | $2,355,165 | $1,375,833 | $979,332 |
| 2016 | $27,986 | $2,308,986 | $1,348,856 | $960,130 |
| 2015 | $27,445 | $2,274,303 | $1,328,595 | $945,708 |
| 2014 | $26,875 | $2,229,753 | $1,302,570 | $927,183 |
Source: Public Records
Map
Nearby Homes
- 14835 Farwell Ave
- 14582 Horseshoe Dr
- 20141 Mendelsohn Ln
- 14685 Horseshoe Dr
- 19661 Saratoga Los Gatos Rd
- 19825 Douglass Ln
- 15181 Hume Dr
- 19305 Zinfandel Ct
- 20063 Spaich Ct
- 15050 Oriole Rd
- 14231 Juniper Ln
- 15253 Montalvo Rd
- 14275 Saratoga Ave
- 14355 Saratoga Ave Unit A
- 14355 Saratoga Ave Unit B
- 14351 Saratoga Ave Unit A
- 19405 Bainter Ave
- 19660 Bainter Way
- 20460 Williams Ave
- 19394 Bainter Ave
- 14760 Farwell Ave
- 14740 Farwell Ave
- 14870 Farwell Ct
- 14860 Farwell Ct
- 14850 Farwell Ave
- 14781 Farwell Ave
- 14720 Farwell Ave
- 14766 Live Oak Ln
- 14880 Farwell Ct
- 14701 Farwell Ave
- 19915 Bella Vista Ave
- 14721 Live Oak Ln
- 14700 Farwell Ave
- 14770 Live Oak Ln
- 14866 Farwell Ave
- 14691 Live Oak Ln
- 19740 Farwell Ave
- 14737 Live Oak Ln
- 14855 Farwell Ave
- 19908 Bella Vista Ave