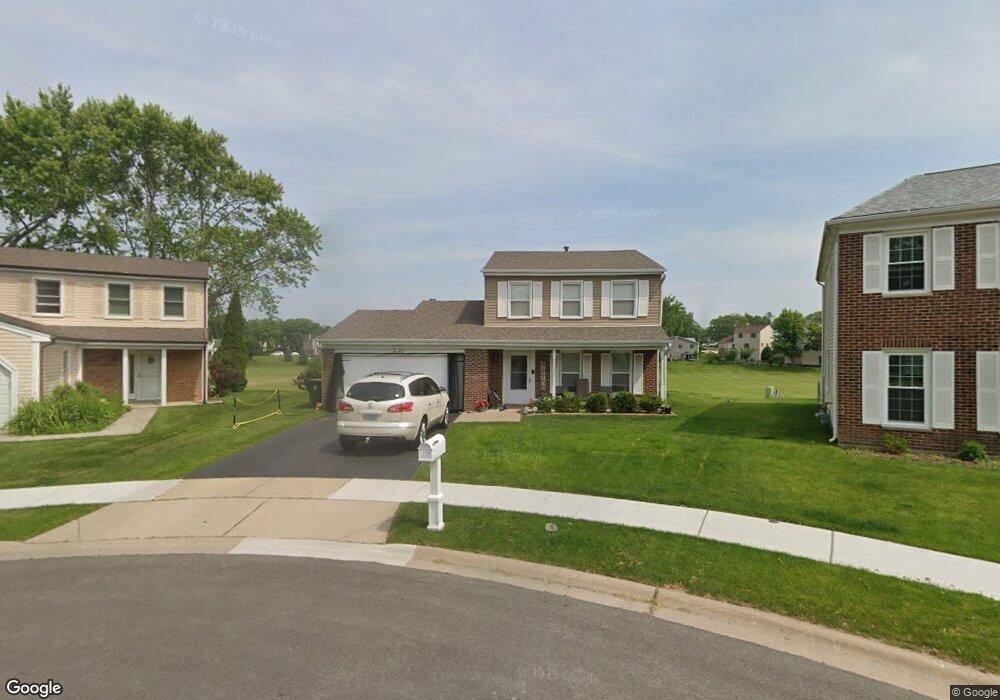
1482 Cameron Ct Hoffman Estates, IL 60010
South Ridge NeighborhoodEstimated Value: $419,000 - $445,000
3
Beds
2
Baths
1,714
Sq Ft
$252/Sq Ft
Est. Value
About This Home
This home is located at 1482 Cameron Ct, Hoffman Estates, IL 60010 and is currently estimated at $431,443, approximately $251 per square foot. 1482 Cameron Ct is a home located in Cook County with nearby schools including Thomas Jefferson Elementary School, Marion Jordan Elementary School, and William Fremd High School.
Ownership History
Date
Name
Owned For
Owner Type
Purchase Details
Closed on
Feb 17, 2017
Sold by
Midwest Investments Group Llc
Bought by
Moca Joseph and Moca Karolina
Current Estimated Value
Home Financials for this Owner
Home Financials are based on the most recent Mortgage that was taken out on this home.
Original Mortgage
$281,200
Outstanding Balance
$231,468
Interest Rate
4.25%
Mortgage Type
New Conventional
Estimated Equity
$199,975
Purchase Details
Closed on
Aug 26, 2016
Sold by
Vladovic Robert J
Bought by
Midwest Investment Group Llc
Purchase Details
Closed on
Sep 8, 1998
Sold by
Vladovic Christine
Bought by
Vladovic Robert J
Home Financials for this Owner
Home Financials are based on the most recent Mortgage that was taken out on this home.
Original Mortgage
$150,300
Interest Rate
7.02%
Create a Home Valuation Report for This Property
The Home Valuation Report is an in-depth analysis detailing your home's value as well as a comparison with similar homes in the area
Home Values in the Area
Average Home Value in this Area
Purchase History
| Date | Buyer | Sale Price | Title Company |
|---|---|---|---|
| Moca Joseph | $296,000 | Chicago Title Insurance Comp | |
| Midwest Investment Group Llc | $178,500 | None Available | |
| Vladovic Robert J | -- | -- |
Source: Public Records
Mortgage History
| Date | Status | Borrower | Loan Amount |
|---|---|---|---|
| Open | Moca Joseph | $281,200 | |
| Previous Owner | Vladovic Robert J | $150,300 |
Source: Public Records
Tax History
| Year | Tax Paid | Tax Assessment Tax Assessment Total Assessment is a certain percentage of the fair market value that is determined by local assessors to be the total taxable value of land and additions on the property. | Land | Improvement |
|---|---|---|---|---|
| 2025 | $8,303 | $37,862 | $6,048 | $31,814 |
| 2024 | $8,303 | $30,397 | $5,184 | $25,213 |
| 2023 | $7,994 | $30,397 | $5,184 | $25,213 |
| 2022 | $7,994 | $30,397 | $5,184 | $25,213 |
| 2021 | $8,049 | $27,368 | $3,600 | $23,768 |
| 2020 | $7,947 | $27,368 | $3,600 | $23,768 |
| 2019 | $7,866 | $30,342 | $3,600 | $26,742 |
| 2018 | $9,266 | $29,247 | $3,312 | $25,935 |
| 2017 | $9,093 | $29,247 | $3,312 | $25,935 |
| 2016 | $7,719 | $29,247 | $3,312 | $25,935 |
| 2015 | $7,415 | $26,480 | $3,024 | $23,456 |
| 2014 | $7,291 | $26,480 | $3,024 | $23,456 |
| 2013 | $7,089 | $26,480 | $3,024 | $23,456 |
Source: Public Records
Map
Nearby Homes
- 4990 Rochester Dr
- 4950 Tarrington Dr
- 5190 Chambers Dr
- 1213 Silver Pine Dr
- 1280 Clover Ln
- 1478 W Sapphire Dr
- 1987 Selkirk Ct
- 4475 Olmstead Dr
- 1520 Macalpin Cir Unit 2
- 2204 Shetland Rd
- 1690 Cape Breton Ct
- 4480 Thornbark Dr
- 217 Haman Rd
- 61 E Palatine Rd
- 4490 Capstan Dr
- 61 E Rd
- 61 E Rd
- 61 E Palatine #4 Rd
- 1340 Macalpin Dr
- 1030 Ridgeview Dr
- 1478 Cameron Ct
- 1486 Cameron Ct
- 1474 Cameron Ct
- 1485 Cameron Ct
- 1470 Cameron Ct
- 1484 Cameron Ct
- 1477 Cameron Ct
- 1471 Cameron Ct
- 1467 Cameron Ct
- 5025 Dukesberry Ln
- 1461 Cameron Ct
- 5040 Rochester Dr
- 1450 Cameron Ct
- 5050 Rochester Dr
- 5031 Dukesberry Ln
- 5010 Rochester Dr
- 5070 Kingston Dr
- 5060 Rochester Dr
- 5021 Dukesberry Ln
- 5080 Kingston Dr
Your Personal Tour Guide
Ask me questions while you tour the home.