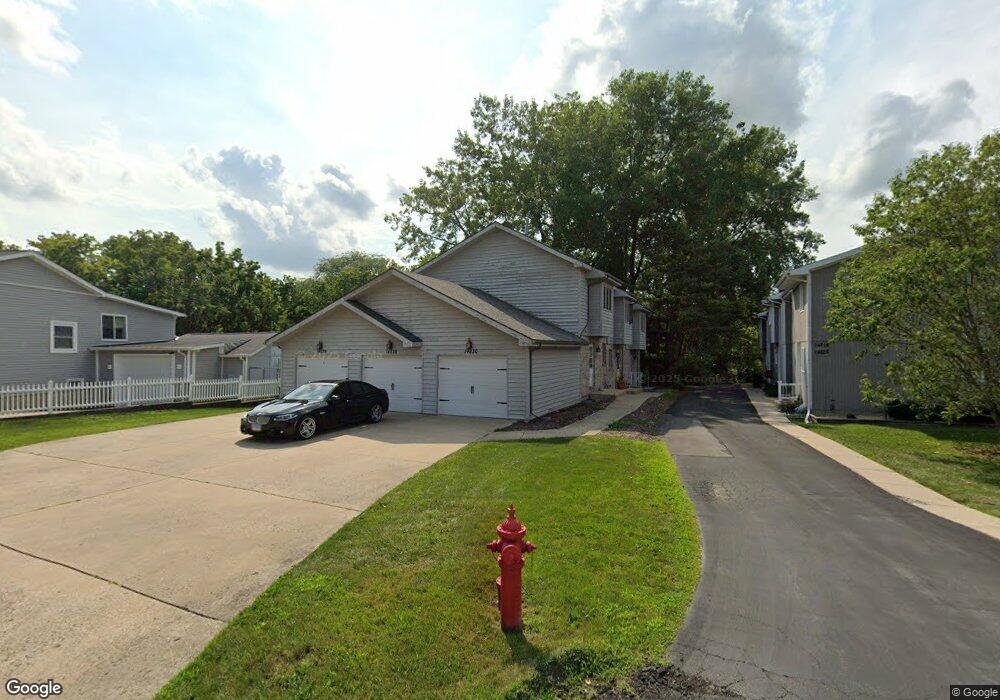
14826 S Penn Rd Plainfield, IL 60544
East Plainfield NeighborhoodEstimated Value: $231,289 - $304,000
2
Beds
2
Baths
1,224
Sq Ft
$219/Sq Ft
Est. Value
About This Home
This home is located at 14826 S Penn Rd, Plainfield, IL 60544 and is currently estimated at $267,822, approximately $218 per square foot. 14826 S Penn Rd is a home located in Will County with nearby schools including Central Elementary School, Indian Trail Middle School, and Plainfield Central High School.
Ownership History
Date
Name
Owned For
Owner Type
Purchase Details
Closed on
Jun 22, 2022
Sold by
Sheriff Of Will County
Bought by
Francis J Savarirayan Md Revocable Trust
Current Estimated Value
Purchase Details
Closed on
Oct 24, 2014
Sold by
Savarirayan Francis
Bought by
Savarirayan Md Francis J and Savarirayan Md Revoc Francis J
Purchase Details
Closed on
Feb 26, 2010
Sold by
Maaske Amy Luft and Luft Amy L
Bought by
Savarirayan Francis
Home Financials for this Owner
Home Financials are based on the most recent Mortgage that was taken out on this home.
Original Mortgage
$151,701
Interest Rate
5.12%
Mortgage Type
FHA
Purchase Details
Closed on
Oct 5, 2004
Sold by
Schultz Paula J and Balka Paula J
Bought by
Noyes Christopher and Noyes Denise
Create a Home Valuation Report for This Property
The Home Valuation Report is an in-depth analysis detailing your home's value as well as a comparison with similar homes in the area
Home Values in the Area
Average Home Value in this Area
Purchase History
| Date | Buyer | Sale Price | Title Company |
|---|---|---|---|
| Francis J Savarirayan Md Revocable Trust | $150,100 | None Listed On Document | |
| Savarirayan Md Francis J | -- | None Available | |
| Savarirayan Francis | $154,500 | First American | |
| Noyes Christopher | $135,000 | Ticor Title Insurance Compan |
Source: Public Records
Mortgage History
| Date | Status | Borrower | Loan Amount |
|---|---|---|---|
| Previous Owner | Savarirayan Francis | $151,701 |
Source: Public Records
Tax History
| Year | Tax Paid | Tax Assessment Tax Assessment Total Assessment is a certain percentage of the fair market value that is determined by local assessors to be the total taxable value of land and additions on the property. | Land | Improvement |
|---|---|---|---|---|
| 2024 | $4,084 | $55,391 | $1 | $55,390 |
| 2023 | $4,084 | $62,566 | $1 | $62,565 |
| 2022 | $3,668 | $56,193 | $1 | $56,192 |
| 2021 | $3,418 | $52,517 | $1 | $52,516 |
| 2020 | $3,349 | $51,027 | $1 | $51,026 |
| 2019 | $3,195 | $48,620 | $1 | $48,619 |
| 2018 | $3,761 | $54,382 | $1 | $54,381 |
| 2017 | $3,607 | $51,679 | $1 | $51,678 |
| 2016 | $3,483 | $49,289 | $1 | $49,288 |
| 2015 | $3,300 | $46,172 | $1 | $46,171 |
| 2014 | $3,300 | $45,432 | $8,891 | $36,541 |
| 2013 | $3,300 | $45,432 | $8,891 | $36,541 |
Source: Public Records
Map
Nearby Homes
- 14816 S Penn Rd
- 25446 W Emory Ln
- 25503 W Emory Ln
- 23909 W Main St
- 000 Wood Farm Rd
- 25518 W Stockwell Dr
- 14860 S Henebry Ln
- 15037 S Darr Dr
- 25500 W Alabaster Cir
- 14865 S Henebry Ln
- 14853 S Henebry Ln
- 25450 W Alabaster Cir
- 25531 W Alabaster Cir
- 14953 S Mccarthy Cir
- 25508 W Alabaster Cir
- 25435 W Alabaster Cir
- 14849 S Henebry Ln
- 14955 S Mccarthy Cir
- 14949 S Mccarthy Cir
- 14953 S Darr Dr
- 14828 S Penn Rd
- 14830 S Penn Rd
- 14826 S Penn Rd
- 14826 S Penn Rd Unit 4
- 14822 S Penn Rd Unit 928
- 14820 S Penn Rd
- 14818 S Penn Rd
- 14814 S Penn Rd
- 14834 S Penn Rd
- 14810 S Penn Rd
- 963 N Penn Rd Unit 963
- 14827 S Penn Rd
- 14811 S Penn Rd
- 14835 S Penn Rd
- 14806 S Penn Rd
- 14807 S Penn Rd
- 14807 S Penn Rd Unit LOWER
- 14839 S Penn Rd
- 14802 S Penn Rd
- 14805 S Penn Rd
Your Personal Tour Guide
Ask me questions while you tour the home.