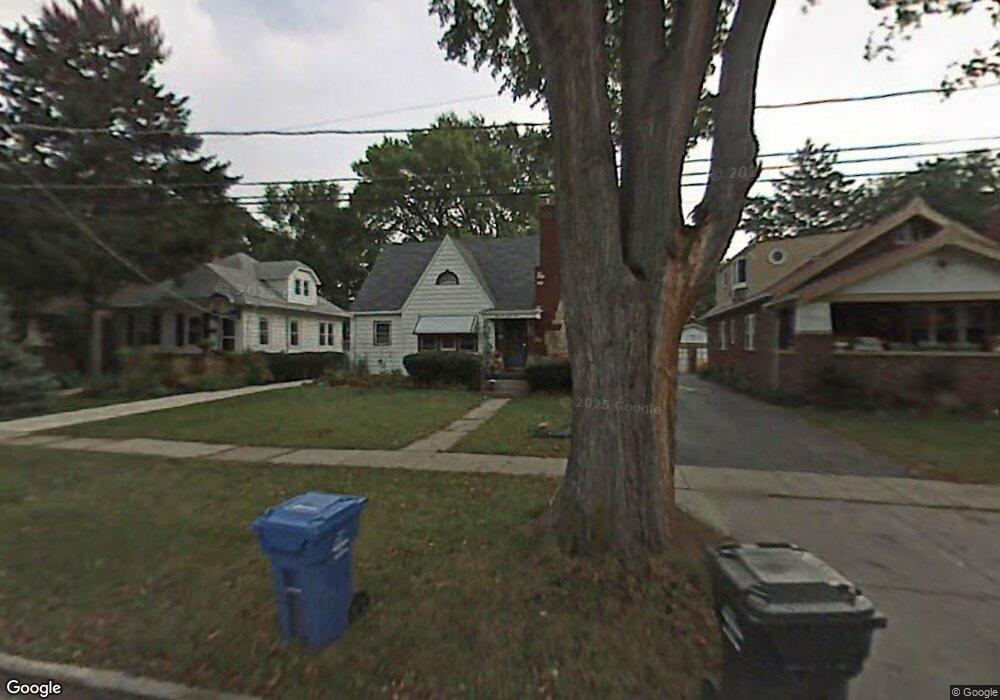
1483 Maple St Des Plaines, IL 60018
Estimated Value: $372,988 - $420,000
4
Beds
2
Baths
1,515
Sq Ft
$260/Sq Ft
Est. Value
About This Home
This home is located at 1483 Maple St, Des Plaines, IL 60018 and is currently estimated at $394,497, approximately $260 per square foot. 1483 Maple St is a home located in Cook County with nearby schools including Central Elementary School, Chippewa Middle School, and Maine West High School.
Ownership History
Date
Name
Owned For
Owner Type
Purchase Details
Closed on
Feb 25, 2003
Sold by
Nelson Jerome M
Bought by
Nelson Patricia A
Current Estimated Value
Home Financials for this Owner
Home Financials are based on the most recent Mortgage that was taken out on this home.
Original Mortgage
$150,000
Outstanding Balance
$21,777
Interest Rate
5.95%
Mortgage Type
Unknown
Estimated Equity
$372,720
Purchase Details
Closed on
Apr 27, 1997
Sold by
Schaefer John A and Witz Susan L
Bought by
Nelson Jerome M and Nelson Patricia A
Home Financials for this Owner
Home Financials are based on the most recent Mortgage that was taken out on this home.
Original Mortgage
$115,000
Interest Rate
8.24%
Purchase Details
Closed on
Dec 23, 1994
Sold by
Maywood Proviso State Bank
Bought by
The Charlotte L Westhouse Trust
Create a Home Valuation Report for This Property
The Home Valuation Report is an in-depth analysis detailing your home's value as well as a comparison with similar homes in the area
Home Values in the Area
Average Home Value in this Area
Purchase History
We collect this data history from publicly available records. To have your information removed, we recommend requesting removal directly through your county’s website.
| Date | Buyer | Sale Price | Title Company |
|---|---|---|---|
| Nelson Patricia A | -- | Ticor | |
| Nelson Patricia A | -- | Ticor | |
| Nelson Jerome M | $150,000 | -- | |
| The Charlotte L Westhouse Trust | -- | -- |
Source: Public Records
Mortgage History
We collect this data history from publicly available records. To have your information removed, we recommend requesting removal directly through your county’s website.
| Date | Status | Borrower | Loan Amount |
|---|---|---|---|
| Open | Nelson Patricia A | $150,000 | |
| Closed | Nelson Patricia A | $150,000 | |
| Previous Owner | Nelson Jerome M | $115,000 |
Source: Public Records
Tax History
| Year | Tax Paid | Tax Assessment Tax Assessment Total Assessment is a certain percentage of the fair market value that is determined by local assessors to be the total taxable value of land and additions on the property. | Land | Improvement |
|---|---|---|---|---|
| 2025 | $6,617 | $39,000 | $8,905 | $30,095 |
| 2024 | $6,617 | $28,414 | $7,915 | $20,499 |
| 2023 | $6,431 | $28,414 | $7,915 | $20,499 |
| 2022 | $6,431 | $28,414 | $7,915 | $20,499 |
| 2021 | $4,887 | $19,230 | $6,431 | $12,799 |
| 2020 | $4,874 | $19,230 | $6,431 | $12,799 |
| 2019 | $4,827 | $21,367 | $6,431 | $14,936 |
| 2018 | $6,099 | $23,830 | $5,689 | $18,141 |
| 2017 | $6,009 | $23,830 | $5,689 | $18,141 |
| 2016 | $5,928 | $23,830 | $5,689 | $18,141 |
| 2015 | $6,003 | $22,480 | $4,947 | $17,533 |
| 2014 | $5,893 | $22,480 | $4,947 | $17,533 |
| 2013 | $5,728 | $22,480 | $4,947 | $17,533 |
Source: Public Records
Map
Nearby Homes
- 1515 Orchard St
- 1640 S River Rd
- 1990 Berry Ln
- 1634 E Forest Ave
- 1280 S River Rd
- 1738 Whitcomb Ave
- 1693 Linden St
- 1220 S River Rd
- 1495 E Algonquin Rd
- 1548 Campbell Ave
- 1653 Stockton Ave
- 1455 Campbell Ave
- 1638 Oakwood Ave
- 1678 Ash St
- 1857 Pine St
- 1524 Oakwood Ave
- 1636 Ashland Ave Unit 309
- 900 S River Rd Unit 4B
- 1491 Ashland Ave Unit 6SW
- 1325 E Walnut Ave
- 1844 E Lincoln Ave
- 1509 Maple St
- 1808 E Lincoln Ave
- 1495 Maple St
- 1500 S River Rd
- 1856 E Lincoln Ave
- 1484 S River Rd
- 1489 Maple St
- 1476 S River Rd
- 1518 S River Rd
- 1473 Maple St
- 1835 E Lincoln Ave
- 1827 E Lincoln Ave
- 1839 E Lincoln Ave
- 1825 Wicke Ave
- 1815 E Lincoln Ave
- 1847 E Lincoln Ave
- 1464 S River Rd
- 1512 Maple St
- 1843 E Lincoln Ave
Your Personal Tour Guide
Ask me questions while you tour the home.