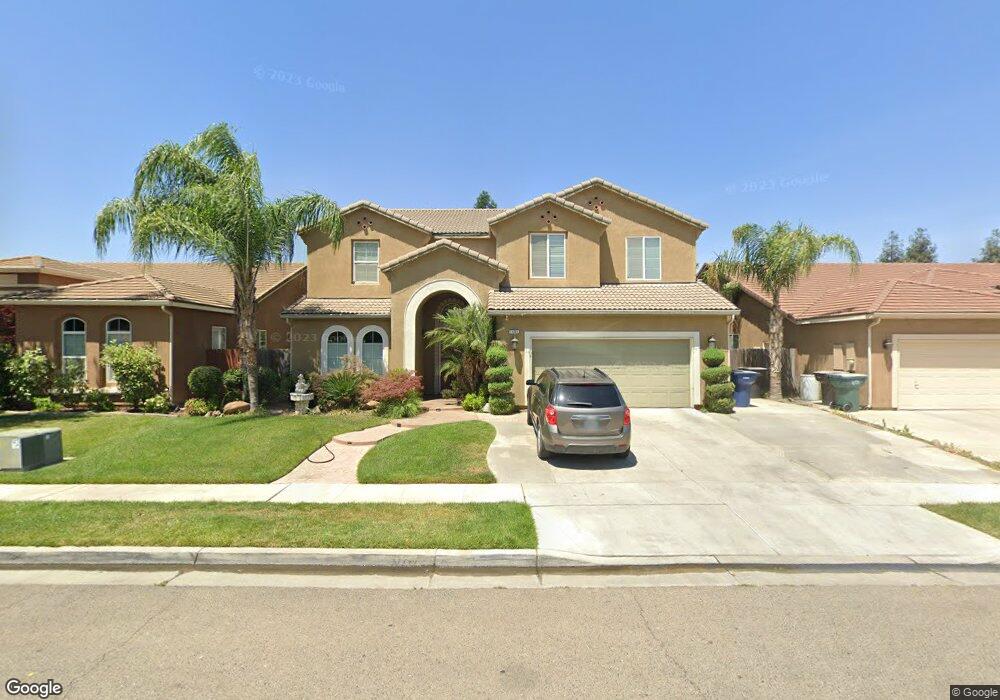
1483 Monsecco St Tulare, CA 93274
Northeast Tulare NeighborhoodEstimated Value: $468,000 - $527,000
3
Beds
3
Baths
2,706
Sq Ft
$183/Sq Ft
Est. Value
About This Home
This home is located at 1483 Monsecco St, Tulare, CA 93274 and is currently estimated at $495,796, approximately $183 per square foot. 1483 Monsecco St is a home located in Tulare County with nearby schools including Mission Valley Elementary School, Live Oak Middle School, and Tulare Union High School.
Ownership History
Date
Name
Owned For
Owner Type
Purchase Details
Closed on
Feb 9, 2017
Sold by
Martin Francisco
Bought by
Francisco & Blanca Martin Living Trust
Current Estimated Value
Purchase Details
Closed on
Mar 6, 2008
Sold by
D R Horton Inc Fresno
Bought by
Martin Francisco
Home Financials for this Owner
Home Financials are based on the most recent Mortgage that was taken out on this home.
Original Mortgage
$200,000
Outstanding Balance
$124,463
Interest Rate
5.72%
Mortgage Type
Purchase Money Mortgage
Estimated Equity
$371,333
Purchase Details
Closed on
Feb 8, 2008
Sold by
Martin Blanca R
Bought by
Martin Francisco
Home Financials for this Owner
Home Financials are based on the most recent Mortgage that was taken out on this home.
Original Mortgage
$200,000
Outstanding Balance
$124,463
Interest Rate
5.72%
Mortgage Type
Purchase Money Mortgage
Estimated Equity
$371,333
Create a Home Valuation Report for This Property
The Home Valuation Report is an in-depth analysis detailing your home's value as well as a comparison with similar homes in the area
Home Values in the Area
Average Home Value in this Area
Purchase History
| Date | Buyer | Sale Price | Title Company |
|---|---|---|---|
| Francisco & Blanca Martin Living Trust | -- | None Available | |
| Martin Francisco | $250,000 | First American | |
| Martin Francisco | -- | First American Title Company |
Source: Public Records
Mortgage History
| Date | Status | Borrower | Loan Amount |
|---|---|---|---|
| Open | Martin Francisco | $200,000 |
Source: Public Records
Tax History
| Year | Tax Paid | Tax Assessment Tax Assessment Total Assessment is a certain percentage of the fair market value that is determined by local assessors to be the total taxable value of land and additions on the property. | Land | Improvement |
|---|---|---|---|---|
| 2025 | $3,832 | $328,378 | $105,080 | $223,298 |
| 2024 | $3,832 | $321,940 | $103,020 | $218,920 |
| 2023 | $3,742 | $315,628 | $101,000 | $214,628 |
| 2022 | $3,641 | $309,440 | $99,020 | $210,420 |
| 2021 | $3,581 | $303,372 | $97,078 | $206,294 |
| 2020 | $1,424 | $300,262 | $96,083 | $204,179 |
| 2019 | $3,647 | $294,374 | $94,199 | $200,175 |
| 2018 | $3,541 | $288,602 | $92,352 | $196,250 |
| 2017 | $3,502 | $282,943 | $90,541 | $192,402 |
| 2016 | $3,356 | $277,395 | $88,766 | $188,629 |
| 2015 | -- | $273,229 | $87,433 | $185,796 |
| 2014 | -- | $267,877 | $85,720 | $182,157 |
Source: Public Records
Map
Nearby Homes
- 1983 Malvasia Ct
- 1923 E Sandalwood Ave
- 1765 E Sandalwood Ave
- 1795 Bettinelli Ct
- 1734 Firestone Dr
- 1205 Jamestown St
- 1563 E Glenwood Ave
- 1823 Rothschild Ave
- 1128 N Jefferson St
- 1582 E Ben Franklin Ave
- 1783 Rosa Ave
- 2222 Diamante Dr
- 2948 Bay Hill Dr
- 2433 Diamante Dr
- 2106 Albarino Ct
- 1159 Syrah Ct
- 2161 Roussanne Ave Unit Sor33
- 2149 Roussanne Ave Unit Sor32
- 2101 Roussanne Ave Unit Sor30
- 2065 Roussanne Ave Unit Sor27
- 1497 Monsecco St
- 1461 Monsecco St
- 1503 Monsecco St
- 1901 Arneis Ave
- 1486 Firestone Dr
- 1502 Firestone Dr
- 1464 Firestone Dr
- 1449 Monsecco St
- 1515 Monsecco St
- 1524 Firestone Dr
- 1442 Firestone Dr
- 1911 Arneis Ave
- 1900 Malvasia Ct
- 1536 Firestone Dr
- 1527 Monsecco St
- 1427 Monsecco St
- 1420 Firestone Dr
- 1920 Arneis Ave
- 1914 Malvasia Ct
- 1925 Arneis Ave
Your Personal Tour Guide
Ask me questions while you tour the home.