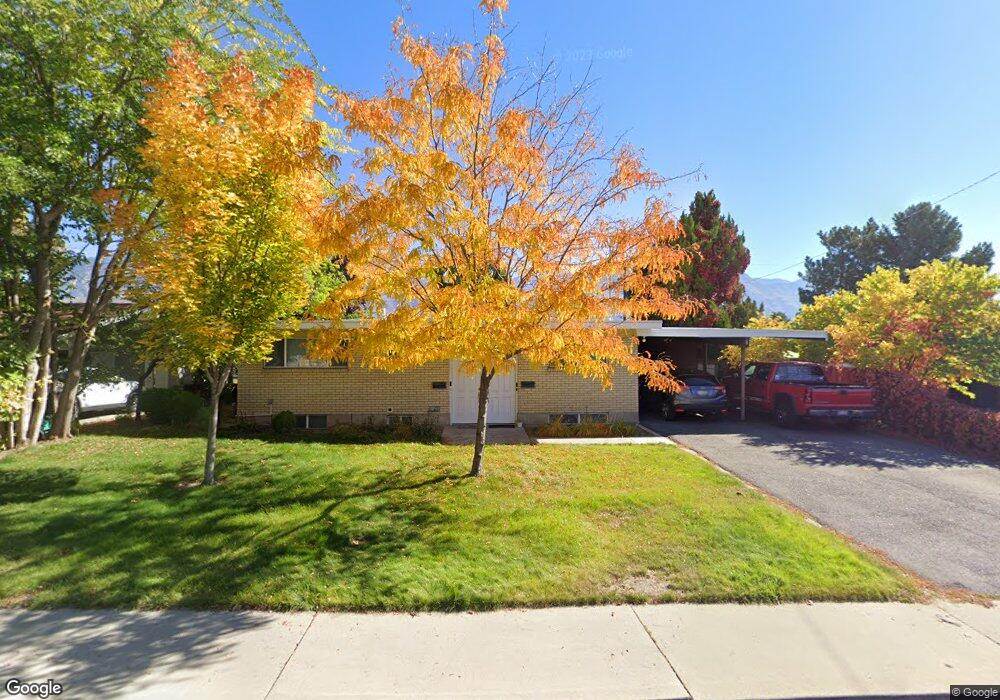
1483 S 320 E Orem, UT 84058
Cherry Hill NeighborhoodEstimated Value: $583,000 - $644,000
4
Beds
2
Baths
1,209
Sq Ft
$507/Sq Ft
Est. Value
About This Home
This home is located at 1483 S 320 E, Orem, UT 84058 and is currently estimated at $613,500, approximately $507 per square foot. 1483 S 320 E is a home located in Utah County with nearby schools including Cherry Hill Elementary School, Lakeridge Jr High School, and Mountain View High School.
Ownership History
Date
Name
Owned For
Owner Type
Purchase Details
Closed on
May 29, 2024
Sold by
S & J Strong 1483S Llc
Bought by
Strong Scott R and Strong Janet A
Current Estimated Value
Purchase Details
Closed on
Jul 1, 2008
Sold by
Strong Scott R and Strong Janet A
Bought by
S&J Strong 1483S Llc
Purchase Details
Closed on
Feb 12, 2008
Sold by
Strong Scotty R and Strong Janet A
Bought by
Strong Scott R and Strong Janet A
Home Financials for this Owner
Home Financials are based on the most recent Mortgage that was taken out on this home.
Original Mortgage
$158,000
Interest Rate
6.04%
Mortgage Type
New Conventional
Purchase Details
Closed on
Jan 16, 2007
Sold by
Riley Dyanne S and Riley Diane S
Bought by
Dharpr Lp
Purchase Details
Closed on
Jan 12, 2007
Sold by
Riley Michael A and Riley Dyanne S
Bought by
Strong Scotty R and Strong Janet A
Purchase Details
Closed on
Jan 22, 2004
Sold by
Riley Michael Arthur and Riley Diane S
Bought by
Dharpr Lp
Create a Home Valuation Report for This Property
The Home Valuation Report is an in-depth analysis detailing your home's value as well as a comparison with similar homes in the area
Home Values in the Area
Average Home Value in this Area
Purchase History
| Date | Buyer | Sale Price | Title Company |
|---|---|---|---|
| Strong Scott R | -- | None Listed On Document | |
| S&J Strong 1483S Llc | -- | None Available | |
| Strong Scott R | -- | Inwest Title Services Inc | |
| Dharpr Lp | -- | Inwest Title Services Inc | |
| Strong Scotty R | -- | Inwest Title Services Inc | |
| Riley Michael A | -- | Inwest Title Services Inc | |
| Dharpr Lp | -- | -- |
Source: Public Records
Mortgage History
| Date | Status | Borrower | Loan Amount |
|---|---|---|---|
| Previous Owner | Strong Scott R | $158,000 |
Source: Public Records
Tax History
| Year | Tax Paid | Tax Assessment Tax Assessment Total Assessment is a certain percentage of the fair market value that is determined by local assessors to be the total taxable value of land and additions on the property. | Land | Improvement |
|---|---|---|---|---|
| 2025 | $2,070 | $300,080 | -- | -- |
| 2024 | $2,070 | $253,110 | $0 | $0 |
| 2023 | $1,907 | $250,580 | $0 | $0 |
| 2022 | $1,814 | $230,945 | $0 | $0 |
| 2021 | $1,675 | $323,000 | $99,000 | $224,000 |
| 2020 | $1,580 | $299,400 | $92,100 | $207,300 |
| 2019 | $1,413 | $278,500 | $85,700 | $192,800 |
| 2018 | $1,286 | $242,200 | $109,600 | $132,600 |
| 2017 | $1,159 | $116,875 | $0 | $0 |
| 2016 | $1,173 | $109,120 | $0 | $0 |
| 2015 | $1,240 | $109,120 | $0 | $0 |
| 2014 | $1,246 | $109,120 | $0 | $0 |
Source: Public Records
Map
Nearby Homes
Your Personal Tour Guide
Ask me questions while you tour the home.