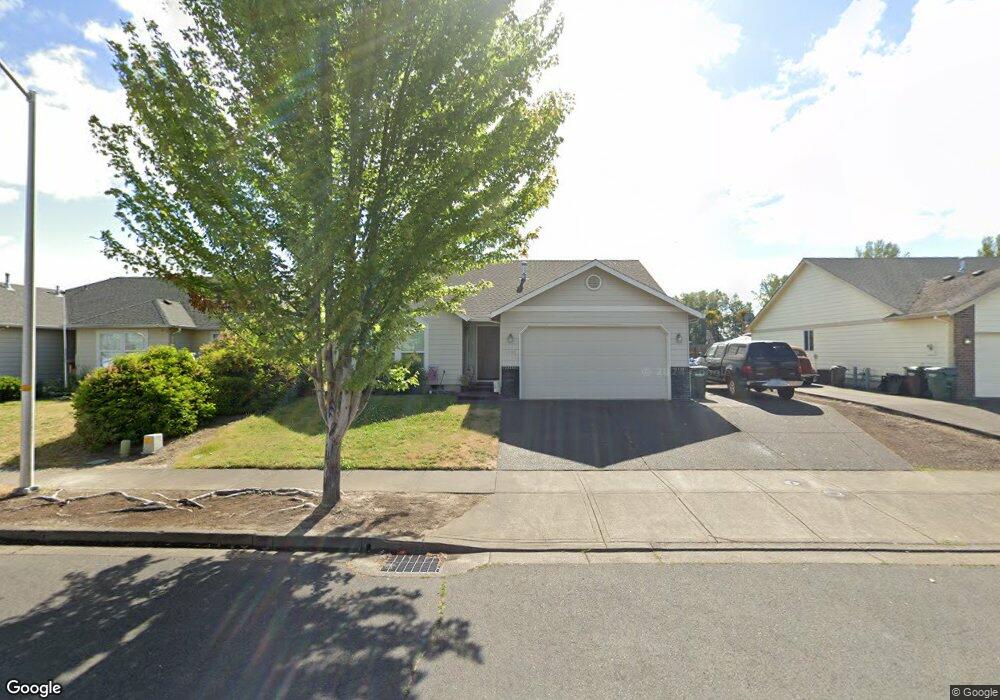
1483 S 6th St Independence, OR 97351
Estimated Value: $406,000 - $418,000
3
Beds
2
Baths
1,340
Sq Ft
$307/Sq Ft
Est. Value
About This Home
This home is located at 1483 S 6th St, Independence, OR 97351 and is currently estimated at $412,037, approximately $307 per square foot. 1483 S 6th St is a home located in Polk County with nearby schools including Independence Elementary School, Talmadge Middle School, and Central High School.
Ownership History
Date
Name
Owned For
Owner Type
Purchase Details
Closed on
Oct 25, 2018
Sold by
Hilliard Antonia Monteiro
Bought by
The Hilliard Property Llc
Current Estimated Value
Purchase Details
Closed on
Aug 12, 2005
Sold by
Pool Brothers Inc
Bought by
Hilliard Ray and Hilliard Antonia Monteiro
Purchase Details
Closed on
Mar 23, 2005
Sold by
Western Oregon Investments Inc
Bought by
Pool Brothers Inc
Create a Home Valuation Report for This Property
The Home Valuation Report is an in-depth analysis detailing your home's value as well as a comparison with similar homes in the area
Home Values in the Area
Average Home Value in this Area
Purchase History
| Date | Buyer | Sale Price | Title Company |
|---|---|---|---|
| The Hilliard Property Llc | -- | None Available | |
| Hilliard Antonia Monteiro | -- | None Available | |
| Hilliard Ray | $159,000 | Ticor Title | |
| Pool Brothers Inc | $81,000 | Ticor Title |
Source: Public Records
Tax History
| Year | Tax Paid | Tax Assessment Tax Assessment Total Assessment is a certain percentage of the fair market value that is determined by local assessors to be the total taxable value of land and additions on the property. | Land | Improvement |
|---|---|---|---|---|
| 2025 | $3,235 | $185,060 | $53,770 | $131,290 |
| 2024 | $3,235 | $179,670 | $52,210 | $127,460 |
| 2023 | $3,319 | $174,440 | $50,690 | $123,750 |
| 2022 | $3,046 | $169,360 | $49,210 | $120,150 |
| 2021 | $3,012 | $164,430 | $47,780 | $116,650 |
| 2020 | $2,934 | $159,650 | $46,390 | $113,260 |
| 2019 | $2,858 | $155,000 | $45,040 | $109,960 |
| 2018 | $2,767 | $150,490 | $43,720 | $106,770 |
| 2017 | $2,752 | $146,110 | $42,450 | $103,660 |
| 2016 | $2,803 | $141,860 | $41,210 | $100,650 |
Source: Public Records
Map
Nearby Homes
Your Personal Tour Guide
Ask me questions while you tour the home.