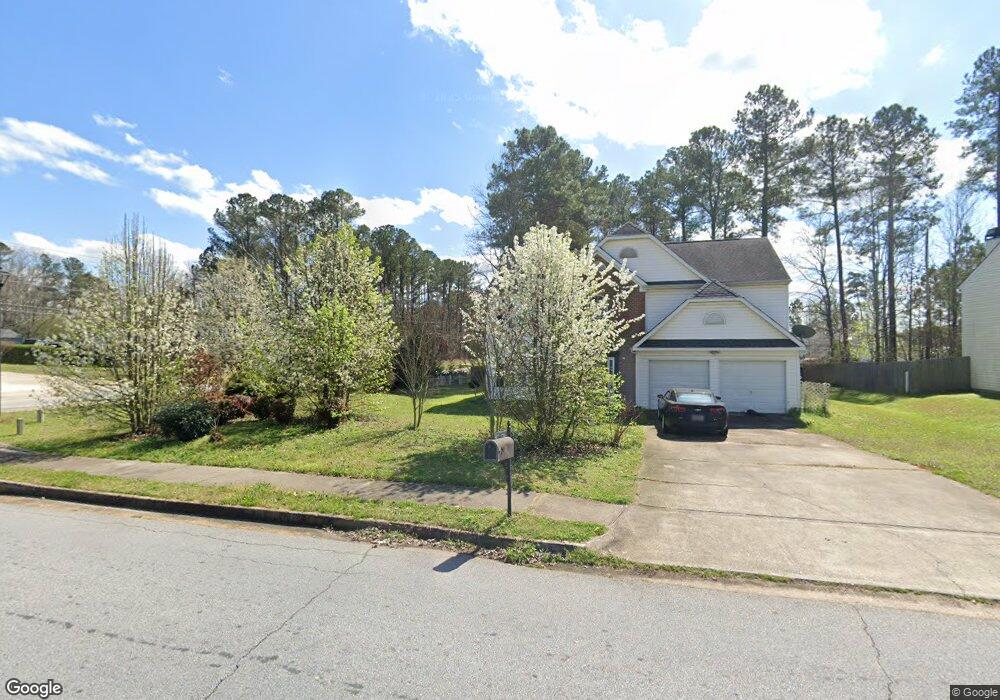
1483 Trafalgar Way 0 Hampton, GA 30228
Estimated Value: $275,000 - $298,000
3
Beds
3
Baths
2,391
Sq Ft
$120/Sq Ft
Est. Value
About This Home
This home is located at 1483 Trafalgar Way 0, Hampton, GA 30228 and is currently estimated at $286,152, approximately $119 per square foot. 1483 Trafalgar Way 0 is a home located in Clayton County with nearby schools including Kemp Primary School, Kemp Elementary School, and Lovejoy Middle School.
Ownership History
Date
Name
Owned For
Owner Type
Purchase Details
Closed on
Mar 29, 2018
Sold by
Loggins Miriam
Bought by
Reid Mark
Current Estimated Value
Home Financials for this Owner
Home Financials are based on the most recent Mortgage that was taken out on this home.
Original Mortgage
$112,000
Outstanding Balance
$96,296
Interest Rate
4.43%
Mortgage Type
New Conventional
Estimated Equity
$189,856
Purchase Details
Closed on
Mar 14, 2016
Sold by
Tran Dung
Bought by
Loggins Miriam
Home Financials for this Owner
Home Financials are based on the most recent Mortgage that was taken out on this home.
Original Mortgage
$75,200
Interest Rate
3.65%
Mortgage Type
New Conventional
Purchase Details
Closed on
Feb 10, 2012
Sold by
Wells Fargo Bank Na Truste
Bought by
Tran Dung
Purchase Details
Closed on
Jun 7, 2011
Sold by
Pope Priscilla A
Bought by
2007-Mln1 Sasco
Purchase Details
Closed on
Mar 26, 1999
Sold by
Inc-Torrey D R Horton
Bought by
Pope Prescilla A
Home Financials for this Owner
Home Financials are based on the most recent Mortgage that was taken out on this home.
Original Mortgage
$124,820
Interest Rate
7.08%
Mortgage Type
FHA
Create a Home Valuation Report for This Property
The Home Valuation Report is an in-depth analysis detailing your home's value as well as a comparison with similar homes in the area
Home Values in the Area
Average Home Value in this Area
Purchase History
| Date | Buyer | Sale Price | Title Company |
|---|---|---|---|
| Reid Mark | $140,000 | -- | |
| Loggins Miriam | $94,000 | -- | |
| Tran Dung | $40,250 | -- | |
| 2007-Mln1 Sasco | $49,050 | -- | |
| Pope Prescilla A | $125,900 | -- |
Source: Public Records
Mortgage History
| Date | Status | Borrower | Loan Amount |
|---|---|---|---|
| Open | Reid Mark | $112,000 | |
| Previous Owner | Loggins Miriam | $75,200 | |
| Previous Owner | Pope Prescilla A | $124,820 |
Source: Public Records
Tax History Compared to Growth
Tax History
| Year | Tax Paid | Tax Assessment Tax Assessment Total Assessment is a certain percentage of the fair market value that is determined by local assessors to be the total taxable value of land and additions on the property. | Land | Improvement |
|---|---|---|---|---|
| 2024 | $4,330 | $121,000 | $8,800 | $112,200 |
| 2023 | $4,217 | $116,800 | $8,800 | $108,000 |
| 2022 | $0 | $100,560 | $8,800 | $91,760 |
| 2021 | $2,773 | $80,200 | $8,800 | $71,400 |
| 2020 | $2,391 | $69,786 | $8,800 | $60,986 |
| 2019 | $1,867 | $56,000 | $6,400 | $49,600 |
| 2018 | $2,120 | $52,230 | $6,400 | $45,830 |
| 2017 | $1,530 | $37,600 | $6,400 | $31,200 |
| 2016 | $1,796 | $44,147 | $6,400 | $37,747 |
| 2015 | $1,783 | $0 | $0 | $0 |
| 2014 | $1,088 | $27,344 | $6,400 | $20,944 |
Source: Public Records
Map
Nearby Homes
- 1438 Starling Ct
- 10553 Eagle Dr
- 1447 Trellis Ct Unit (LOT 6)
- 10725 Barberry Dr Unit 5
- 10413 Trellis Ln Unit (LOT 33)
- 10429 Trellis Ln
- 10413 Trellis Ln
- 10425 Trellis Ln
- 10425 Trellis Ln Unit (LOT 30)
- 10429 Trellis Ln Unit (LOT 29)
- 1435 Trellis Ct Unit (LOT 8)
- 10571 Starling Trail Unit II
- 1590 Flicker Rd
- 10422 Trellis Ln
- 10453 Trellis Ln
- 10453 Trellis Ln Unit (LOT 28)
- 10410 Trellis Ln Unit (LOT 35)
- 10422 Trellis Ln Unit (LOT 38)
- 1646 Flicker Rd
- 10448 Tara Pointe Dr
- 1483 Trafalgar Way
- 1475 Trafalgar Way
- 1482 Trafalgar Ct
- 1467 Trafalgar Way Unit VI
- 1467 Trafalgar Way
- 10363 Starling Trail Unit VI
- 1474 Trafalgar Ct
- 10622 Panhandle Rd
- 1459 Trafalgar Way Unit VI
- 1459 Trafalgar Way
- 10371 Starling Trail
- 10371 Starling Trail
- 1485 Trafalgar Ct Unit I
- 1466 Trafalgar Ct
- 1462 Trafalgar Way Unit III
- 1451 Trafalgar Way Unit VI
- 1451 Trafalgar Way
- 10379 Starling Trail
- 1458 Trafalgar Ct Unit 1
- 1481 Trafalgar Ct Unit 1