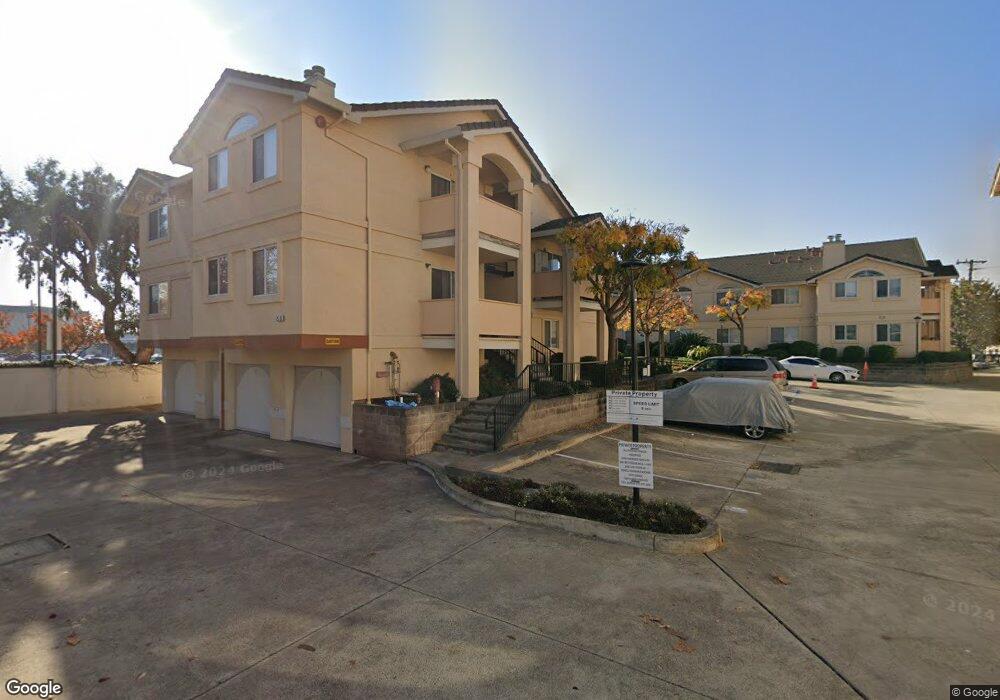
14835 E 14th St Unit 21 San Leandro, CA 94578
Lower Bal NeighborhoodEstimated Value: $392,000 - $436,000
2
Beds
2
Baths
958
Sq Ft
$440/Sq Ft
Est. Value
About This Home
This home is located at 14835 E 14th St Unit 21, San Leandro, CA 94578 and is currently estimated at $421,296, approximately $439 per square foot. 14835 E 14th St Unit 21 is a home located in Alameda County with nearby schools including Jefferson Elementary School, Bancroft Middle School, and San Leandro High School.
Ownership History
Date
Name
Owned For
Owner Type
Purchase Details
Closed on
May 10, 2025
Sold by
Phan Nghia Trung and Phan Nghia John
Bought by
Phan/Chan Family Trust and Phan
Current Estimated Value
Purchase Details
Closed on
Jan 14, 2010
Sold by
Federal Home Loan Mortgage Corporation
Bought by
Phan Nghia Trung and Chan Lannie
Purchase Details
Closed on
Sep 15, 2009
Sold by
Lat Ramon G and Lat Honorata P
Bought by
Federal Home Loan Mortgage Corporation
Purchase Details
Closed on
Sep 12, 1997
Sold by
Bay O Vista Realty Inc
Bought by
Lat Ramon G and Lat Honorata P
Home Financials for this Owner
Home Financials are based on the most recent Mortgage that was taken out on this home.
Original Mortgage
$133,550
Interest Rate
7.45%
Mortgage Type
FHA
Create a Home Valuation Report for This Property
The Home Valuation Report is an in-depth analysis detailing your home's value as well as a comparison with similar homes in the area
Home Values in the Area
Average Home Value in this Area
Purchase History
| Date | Buyer | Sale Price | Title Company |
|---|---|---|---|
| Phan/Chan Family Trust | -- | None Listed On Document | |
| Phan Nghia Trung | $154,000 | Lsi Title Company | |
| Federal Home Loan Mortgage Corporation | $348,821 | Fidelity Natl Title Ins Co | |
| Lat Ramon G | $138,500 | Placer Title Company |
Source: Public Records
Mortgage History
| Date | Status | Borrower | Loan Amount |
|---|---|---|---|
| Previous Owner | Lat Ramon G | $133,550 |
Source: Public Records
Tax History
| Year | Tax Paid | Tax Assessment Tax Assessment Total Assessment is a certain percentage of the fair market value that is determined by local assessors to be the total taxable value of land and additions on the property. | Land | Improvement |
|---|---|---|---|---|
| 2025 | $3,064 | $198,771 | $59,631 | $139,140 |
| 2024 | $3,064 | $194,875 | $58,462 | $136,413 |
| 2023 | $3,085 | $191,054 | $57,316 | $133,738 |
| 2022 | $2,981 | $187,310 | $56,193 | $131,117 |
| 2021 | $2,885 | $183,638 | $55,091 | $128,547 |
| 2020 | $2,802 | $181,756 | $54,527 | $127,229 |
| 2019 | $2,711 | $178,193 | $53,458 | $124,735 |
| 2018 | $2,658 | $174,700 | $52,410 | $122,290 |
| 2017 | $2,519 | $171,275 | $51,382 | $119,893 |
| 2016 | $2,433 | $167,917 | $50,375 | $117,542 |
| 2015 | $2,384 | $165,397 | $49,619 | $115,778 |
| 2014 | $2,364 | $162,158 | $48,647 | $113,511 |
Source: Public Records
Map
Nearby Homes
- 14831 Bancroft Ave Unit Space 27
- 14621 Pansy St
- 15065 Hesperian Blvd Unit 22
- 14787 Oleander St
- 1541 152nd Ave
- 804 Crocus Dr
- 0 Saturn Dr
- 1512 Oriole Ave
- 2724 Benedict Dr
- 15289 Upton Ave
- 14828 Martell Ave
- 1726 137th Ave
- 1269 Gabriel Ct
- 391 Anza Way
- 2399 E 14th St Unit 60
- 2399 E 14th St Unit 93
- 2399 E 14th St Unit 112
- 2399 E 14th St Unit 44
- 16006 E 14th St Unit 101
- 16006 E 14th St Unit 213
- 14835 E 14th St Unit 27
- 14835 E 14th St Unit 28
- 14835 E 14th St Unit 26
- 14835 E 14th St Unit 17
- 14835 E 14th St Unit 23
- 14835 E 14th St Unit 24
- 14835 E 14th St Unit 22
- 14835 E 14th St Unit 20
- 14835 E 14th St Unit 3
- 14835 E 14th St Unit 1
- 14835 E 14th St Unit 25
- 14835 E 14th St Unit 19
- 14835 E 14th St Unit 18
- 14835 E 14th St Unit 14
- 14835 E 14th St Unit 10
- 14835 E 14th St Unit 11
- 14835 E 14th St Unit 8
- 14835 E 14th St Unit 6
- 14835 E 14th St Unit 7
- 14835 E 14th St Unit 5
Your Personal Tour Guide
Ask me questions while you tour the home.