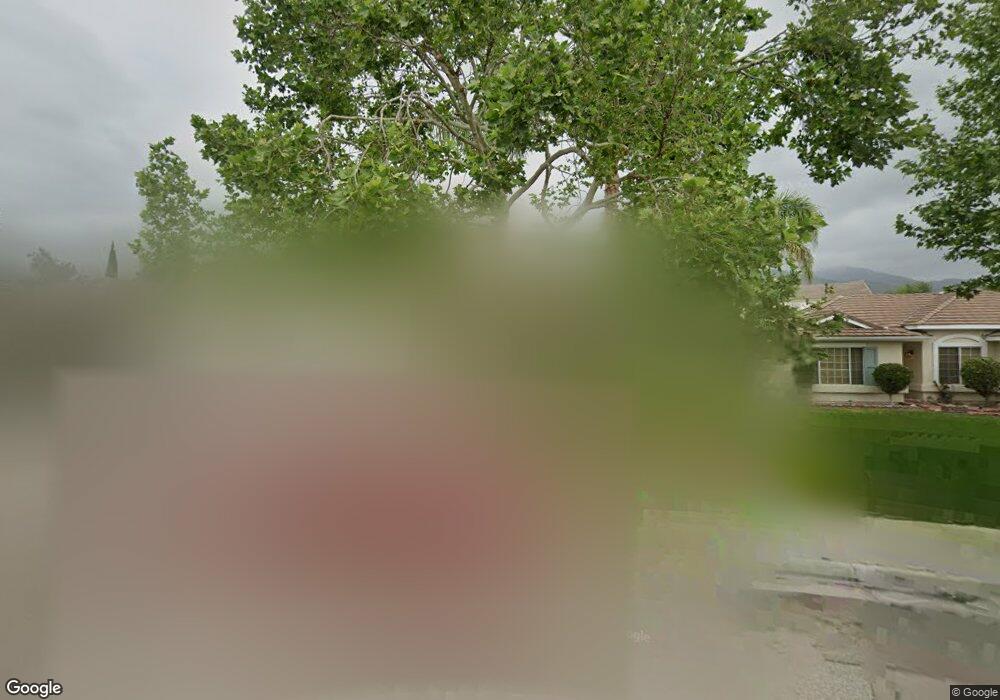
1484 Keystone Dr San Bernardino, CA 92407
University NeighborhoodEstimated Value: $473,000 - $748,000
6
Beds
4
Baths
2,505
Sq Ft
$251/Sq Ft
Est. Value
About This Home
This home is located at 1484 Keystone Dr, San Bernardino, CA 92407 and is currently estimated at $627,595, approximately $250 per square foot. 1484 Keystone Dr is a home located in San Bernardino County with nearby schools including Bob Holcomb Elementary School, Shandin Hills Middle School, and Cajon High School.
Ownership History
Date
Name
Owned For
Owner Type
Purchase Details
Closed on
Jun 29, 1998
Sold by
Hud
Bought by
Ayala Miguel Angel and Ayala Ana
Current Estimated Value
Home Financials for this Owner
Home Financials are based on the most recent Mortgage that was taken out on this home.
Original Mortgage
$104,806
Outstanding Balance
$21,318
Interest Rate
6.93%
Mortgage Type
FHA
Estimated Equity
$606,277
Purchase Details
Closed on
Mar 24, 1998
Sold by
Norwest Mtg Inc
Bought by
Hud
Purchase Details
Closed on
Aug 29, 1997
Sold by
Walker Lee A and Walker Denise K
Bought by
Norwest Mtg Inc
Purchase Details
Closed on
Jun 9, 1994
Sold by
Barratt American Inc
Bought by
Walker Lee A and Walker Denise K
Home Financials for this Owner
Home Financials are based on the most recent Mortgage that was taken out on this home.
Original Mortgage
$137,684
Interest Rate
8.56%
Mortgage Type
FHA
Create a Home Valuation Report for This Property
The Home Valuation Report is an in-depth analysis detailing your home's value as well as a comparison with similar homes in the area
Home Values in the Area
Average Home Value in this Area
Purchase History
| Date | Buyer | Sale Price | Title Company |
|---|---|---|---|
| Ayala Miguel Angel | $103,000 | Orange Coast Title | |
| Hud | -- | Fidelity National Title Ins | |
| Norwest Mtg Inc | $154,735 | Fidelity National Title Ins | |
| Walker Lee A | $140,000 | First American Title Ins Co |
Source: Public Records
Mortgage History
| Date | Status | Borrower | Loan Amount |
|---|---|---|---|
| Open | Ayala Miguel Angel | $104,806 | |
| Previous Owner | Walker Lee A | $137,684 |
Source: Public Records
Tax History Compared to Growth
Tax History
| Year | Tax Paid | Tax Assessment Tax Assessment Total Assessment is a certain percentage of the fair market value that is determined by local assessors to be the total taxable value of land and additions on the property. | Land | Improvement |
|---|---|---|---|---|
| 2025 | $3,214 | $243,469 | $40,759 | $202,710 |
| 2024 | $3,214 | $238,695 | $39,960 | $198,735 |
| 2023 | $3,136 | $234,014 | $39,176 | $194,838 |
| 2022 | $3,139 | $229,426 | $38,408 | $191,018 |
| 2021 | $3,141 | $224,928 | $37,655 | $187,273 |
| 2020 | $3,147 | $222,622 | $37,269 | $185,353 |
| 2019 | $3,058 | $218,257 | $36,538 | $181,719 |
| 2018 | $3,030 | $213,978 | $35,822 | $178,156 |
| 2017 | $2,940 | $209,783 | $35,120 | $174,663 |
| 2016 | $2,855 | $205,669 | $34,431 | $171,238 |
| 2015 | $2,753 | $202,580 | $33,914 | $168,666 |
| 2014 | $2,679 | $198,612 | $33,250 | $165,362 |
Source: Public Records
Map
Nearby Homes
- 5205 N Mammoth Dr
- 5294 Sundance Dr
- 1380 W 48th St Unit 30
- 4834 Alta Dr
- 1503 Indian Trail
- 1559 Wild Pony Path
- 4905 Village Green Way
- 10 Kendall Dr
- 4729 Windsor Ct
- 5548 Westwind Dr
- 1548 Teton St
- 4231 N 4th Ave
- 1511 Yardley St
- 1594 Morgan Rd
- 1951 Provost Ct
- 4281 Mountain Dr
- 5370 N Alumni Ln
- 1265 Kendall Dr Unit 723
- 1265 Kendall Dr
- 1265 Kendall Dr Unit 811
- 1478 Keystone Dr
- 1488 Keystone Dr
- 1485 Northstar St
- 1474 Keystone Dr
- 1479 Northstar St
- 1494 Keystone Dr
- 1485 Keystone Dr
- 1471 Northstar St
- 1479 Keystone Dr
- 1495 Keystone Dr
- 1468 Keystone Dr
- 1469 Keystone Dr
- 1465 Northstar St
- 1464 Keystone Dr
- 1484 Steamboat Cir
- 1494 Steamboat Cir
- 5338 Brighton Ct
- 5234 Mammoth Dr
- 1459 Northstar St
- 1458 Keystone Dr