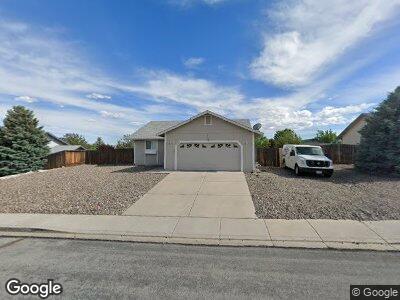
1484 Wagtail Dr Sparks, NV 89441
Eagle Canyon-Pebble Creek NeighborhoodEstimated Value: $479,709 - $519,000
3
Beds
2
Baths
1,334
Sq Ft
$374/Sq Ft
Est. Value
About This Home
This home is located at 1484 Wagtail Dr, Sparks, NV 89441 and is currently estimated at $499,177, approximately $374 per square foot. 1484 Wagtail Dr is a home located in Washoe County with nearby schools including Jesse Hall Elementery School, Yvonne Shaw Middle School, and Spanish Springs High School.
Ownership History
Date
Name
Owned For
Owner Type
Purchase Details
Closed on
Sep 27, 2013
Sold by
Munoz Mark Anthony
Bought by
Tigre Llc
Current Estimated Value
Home Financials for this Owner
Home Financials are based on the most recent Mortgage that was taken out on this home.
Original Mortgage
$1,667,000
Outstanding Balance
$1,269,260
Interest Rate
4.46%
Mortgage Type
Unknown
Estimated Equity
-$770,083
Purchase Details
Closed on
Mar 29, 2005
Sold by
Munoz Mark
Bought by
Munoz Mark Anthony and The Mark Anthony Munoz Trust
Purchase Details
Closed on
Dec 9, 2002
Sold by
Munoz Mark A
Bought by
Munoz Mark
Home Financials for this Owner
Home Financials are based on the most recent Mortgage that was taken out on this home.
Original Mortgage
$125,600
Interest Rate
6.03%
Purchase Details
Closed on
May 7, 2002
Sold by
Eagle Canyon C Llc
Bought by
Munoz Mark A
Home Financials for this Owner
Home Financials are based on the most recent Mortgage that was taken out on this home.
Original Mortgage
$123,975
Interest Rate
7.13%
Create a Home Valuation Report for This Property
The Home Valuation Report is an in-depth analysis detailing your home's value as well as a comparison with similar homes in the area
Home Values in the Area
Average Home Value in this Area
Purchase History
| Date | Buyer | Sale Price | Title Company |
|---|---|---|---|
| Tigre Llc | -- | Ticor Title Reno | |
| Munoz Mark Anthony | -- | None Available | |
| Munoz Mark | -- | Western Title Inc | |
| Munoz Mark A | $137,750 | Western Title Inc |
Source: Public Records
Mortgage History
| Date | Status | Borrower | Loan Amount |
|---|---|---|---|
| Open | Tigre Llc | $1,667,000 | |
| Previous Owner | Munoz Mark | $125,600 | |
| Previous Owner | Munoz Mark A | $123,975 |
Source: Public Records
Tax History Compared to Growth
Tax History
| Year | Tax Paid | Tax Assessment Tax Assessment Total Assessment is a certain percentage of the fair market value that is determined by local assessors to be the total taxable value of land and additions on the property. | Land | Improvement |
|---|---|---|---|---|
| 2025 | $2,332 | $91,956 | $38,640 | $53,316 |
| 2024 | $2,332 | $89,108 | $35,420 | $53,688 |
| 2023 | $2,158 | $88,558 | $37,730 | $50,828 |
| 2022 | $2,000 | $73,023 | $30,660 | $42,363 |
| 2021 | $1,854 | $66,450 | $24,255 | $42,195 |
| 2020 | $1,806 | $65,954 | $23,695 | $42,259 |
| 2019 | $1,658 | $63,389 | $22,540 | $40,849 |
| 2018 | $1,583 | $57,269 | $17,325 | $39,944 |
| 2017 | $1,520 | $56,540 | $16,555 | $39,985 |
| 2016 | $1,481 | $55,057 | $14,210 | $40,847 |
| 2015 | $373 | $53,868 | $13,090 | $40,778 |
| 2014 | $1,435 | $51,188 | $12,110 | $39,078 |
| 2013 | -- | $42,856 | $8,155 | $34,701 |
Source: Public Records
Map
Nearby Homes
- 1018 Ringneck Way
- 1018 Rook Way
- 2036 Flycatcher Ct
- 961 Ruddy Ct Unit 3
- 1458 Rosy Finch Dr
- 1098 Hallertau Dr
- 1427 Rosy Finch Dr
- 2172 Redhead Dr
- 68 Rook Ct
- 1188 Bramling Cross Dr Unit 3
- 1023 Carico Valley Place
- 2258 Albatross Way
- 1349 Nightingale Way
- 2183 Kingston Canyon Dr
- 980 Mojave Desert Dr
- 15 Cormorant Ct
- 908 Sand Springs Dr
- 1981 Lanstar Dr
- 706 Ten Penny Dr
- 145 Eclipse Dr
- 1484 Wagtail Dr
- 1480 Wagtail Dr
- 1488 Wagtail Dr
- 1046 Ringneck Way
- 1050 Ringneck Way
- 2124 Albatross Way
- 1042 Ringneck Way
- 1476 Wagtail Dr
- 2131 Tanager Ct
- 1038 Ringneck Way
- 2121 Albatross Way
- 2128 Albatross Way
- 1472 Wagtail Dr
- 2135 Tanager Ct Unit 1
- 1047 Ringneck Way
- 2123 Albatross Way
- 2117 Albatross Way
- 2132 Tanager Ct
- 1043 Ringneck Way
- 1082 Golden Plover Ct Unit 1