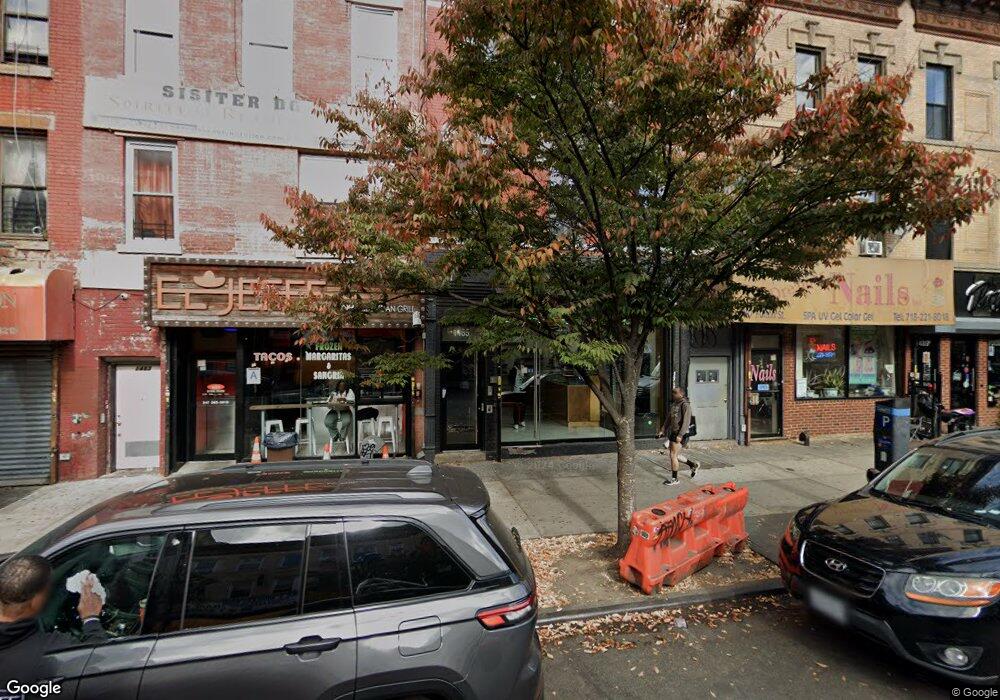
1485 Fulton St Brooklyn, NY 11216
Bed-Stuy NeighborhoodEstimated Value: $1,389,770
--
Bed
--
Bath
2,470
Sq Ft
$563/Sq Ft
Est. Value
About This Home
This home is located at 1485 Fulton St, Brooklyn, NY 11216 and is currently estimated at $1,389,770, approximately $562 per square foot. 1485 Fulton St is a home located in Kings County with nearby schools including P.S. 93 - William H. Prescott and Leadership Preparatory Bedford Stuyvesant Charter School.
Ownership History
Date
Name
Owned For
Owner Type
Purchase Details
Closed on
Jul 17, 2025
Sold by
Oliam Suncoast Llc
Bought by
1485 Fulton Street Llc
Current Estimated Value
Home Financials for this Owner
Home Financials are based on the most recent Mortgage that was taken out on this home.
Original Mortgage
$535,000
Outstanding Balance
$534,087
Interest Rate
6.81%
Mortgage Type
Purchase Money Mortgage
Estimated Equity
$855,683
Purchase Details
Closed on
Dec 19, 2016
Sold by
Emeagwali Stella
Bought by
Oliam Suncoast Llc
Home Financials for this Owner
Home Financials are based on the most recent Mortgage that was taken out on this home.
Original Mortgage
$825,000
Interest Rate
3.57%
Mortgage Type
Commercial
Purchase Details
Closed on
Dec 8, 1998
Sold by
Moore Mary
Bought by
Emeagwali Stella
Home Financials for this Owner
Home Financials are based on the most recent Mortgage that was taken out on this home.
Original Mortgage
$172,300
Interest Rate
6.74%
Mortgage Type
FHA
Create a Home Valuation Report for This Property
The Home Valuation Report is an in-depth analysis detailing your home's value as well as a comparison with similar homes in the area
Home Values in the Area
Average Home Value in this Area
Purchase History
| Date | Buyer | Sale Price | Title Company |
|---|---|---|---|
| 1485 Fulton Street Llc | $1,250,000 | -- | |
| Oliam Suncoast Llc | $1,070,000 | -- | |
| Emeagwali Stella | $160,000 | -- | |
| Emeagwali Stella | $160,000 | -- |
Source: Public Records
Mortgage History
| Date | Status | Borrower | Loan Amount |
|---|---|---|---|
| Open | 1485 Fulton Street Llc | $535,000 | |
| Previous Owner | Oliam Suncoast Llc | $825,000 | |
| Previous Owner | Emeagwali Stella | $172,300 |
Source: Public Records
Tax History Compared to Growth
Tax History
| Year | Tax Paid | Tax Assessment Tax Assessment Total Assessment is a certain percentage of the fair market value that is determined by local assessors to be the total taxable value of land and additions on the property. | Land | Improvement |
|---|---|---|---|---|
| 2025 | $6,277 | $122,220 | $13,560 | $108,660 |
| 2024 | $6,277 | $97,560 | $13,560 | $84,000 |
| 2023 | $5,988 | $86,220 | $13,560 | $72,660 |
| 2022 | $5,851 | $67,680 | $13,560 | $54,120 |
| 2021 | $5,493 | $63,900 | $13,560 | $50,340 |
| 2020 | $3,694 | $76,980 | $13,560 | $63,420 |
| 2019 | $5,754 | $81,000 | $13,560 | $67,440 |
| 2018 | $4,020 | $14,112 | $3,471 | $10,641 |
| 2017 | $2,847 | $13,968 | $3,681 | $10,287 |
| 2016 | $2,709 | $13,552 | $4,290 | $9,262 |
| 2015 | $1,370 | $12,787 | $4,852 | $7,935 |
| 2014 | $1,370 | $12,465 | $5,675 | $6,790 |
Source: Public Records
Map
Nearby Homes
- 359 Herkimer St
- 385 Herkimer St
- 125 Macdonough St
- 231 Macon St
- 106 Decatur St
- 176 Macon St
- 251 Macon St
- 4 Alice Ct
- 9 Agate Ct
- 318 Halsey St
- 259 Halsey St Unit 4R
- 259 Halsey St Unit 1R
- 259 Halsey St Unit 2R
- 259 Halsey St Unit 3F
- 259 Halsey St Unit 2F
- 137 Decatur St
- 344 Hancock St
- 6 Herkimer Ct
- 370 Hancock St Unit TWNHS
- 370 Hancock St
- 1485 Fulton St Unit 2
- 1485 Fulton St Unit 1A
- 1487 Fulton St
- 1483 Fulton St
- 1483 Fulton St Unit COMMERCIAL
- 1489 Fulton St
- 36 Decatur St
- 1481 Fulton St
- 38 Decatur St
- 38 Decatur St
- 38 Decatur St
- 38 Decatur St
- 38 Decatur St
- 1491 Fulton St
- 1479 Fulton St
- 40 Decatur St
- 40 Decatur St Unit 1
- 40 Decatur St Unit 2
- 1493 Fulton St
- 42 Decatur St