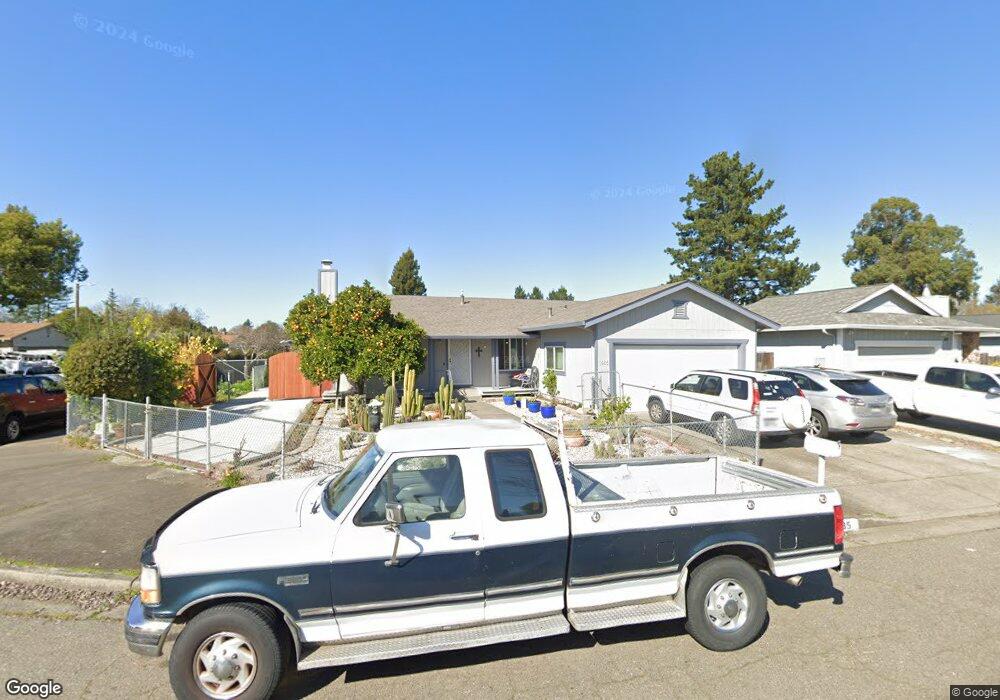
1485 Funston Dr Santa Rosa, CA 95407
Roseland NeighborhoodEstimated Value: $590,114 - $653,000
3
Beds
2
Baths
1,348
Sq Ft
$461/Sq Ft
Est. Value
About This Home
This home is located at 1485 Funston Dr, Santa Rosa, CA 95407 and is currently estimated at $620,779, approximately $460 per square foot. 1485 Funston Dr is a home located in Sonoma County with nearby schools including Elsie Allen High School, Kid Street Charter School, and St. Michael's Orthodox School.
Ownership History
Date
Name
Owned For
Owner Type
Purchase Details
Closed on
Jan 8, 2014
Sold by
Araya Girmai K and Araya Lavonne S
Bought by
Araya Girmai K and Araya Lavonne S
Current Estimated Value
Purchase Details
Closed on
Jan 19, 1996
Sold by
Araya Lavonne Sampietro and Araya Girmay K
Bought by
Araya Lavonne Sampietro and Araya Girmay K
Home Financials for this Owner
Home Financials are based on the most recent Mortgage that was taken out on this home.
Original Mortgage
$100,000
Interest Rate
7.18%
Purchase Details
Closed on
May 3, 1994
Sold by
Flannery Joe W and Flannery Teresa J
Bought by
Araya Lavonne Sampietro and Araya Girmay K
Home Financials for this Owner
Home Financials are based on the most recent Mortgage that was taken out on this home.
Original Mortgage
$100,000
Interest Rate
7.84%
Create a Home Valuation Report for This Property
The Home Valuation Report is an in-depth analysis detailing your home's value as well as a comparison with similar homes in the area
Home Values in the Area
Average Home Value in this Area
Purchase History
| Date | Buyer | Sale Price | Title Company |
|---|---|---|---|
| Araya Girmai K | -- | None Available | |
| Araya Lavonne Sampietro | -- | Fidelity National Title Ins | |
| Araya Lavonne Sampietro | $142,500 | Fidelity National Title Ins |
Source: Public Records
Mortgage History
| Date | Status | Borrower | Loan Amount |
|---|---|---|---|
| Previous Owner | Araya Lavonne Sampietro | $100,000 | |
| Previous Owner | Araya Lavonne Sampietro | $100,000 |
Source: Public Records
Tax History
| Year | Tax Paid | Tax Assessment Tax Assessment Total Assessment is a certain percentage of the fair market value that is determined by local assessors to be the total taxable value of land and additions on the property. | Land | Improvement |
|---|---|---|---|---|
| 2025 | $3,824 | $239,675 | $109,326 | $130,349 |
| 2024 | $3,824 | $234,977 | $107,183 | $127,794 |
| 2023 | $3,824 | $230,371 | $105,082 | $125,289 |
| 2022 | $3,280 | $225,855 | $103,022 | $122,833 |
| 2021 | $3,297 | $221,427 | $101,002 | $120,425 |
| 2020 | $3,029 | $219,158 | $99,967 | $119,191 |
| 2019 | $3,083 | $214,861 | $98,007 | $116,854 |
| 2018 | $3,227 | $210,649 | $96,086 | $114,563 |
| 2017 | $3,210 | $206,519 | $94,202 | $112,317 |
| 2016 | $3,153 | $202,470 | $92,355 | $110,115 |
| 2015 | $3,052 | $199,429 | $90,968 | $108,461 |
| 2014 | $2,936 | $195,524 | $89,187 | $106,337 |
Source: Public Records
Map
Nearby Homes
- 1863 Beachwood Dr
- 1704 Dutton Ave
- 0 West Ave Unit 325019616
- 1962 Las Ventanas Dr
- 1911 Corby Ave
- 1964 Las Ventanas Dr
- 780 Dutton Ave
- 919 Naify Ln
- 733 Leo Dr
- 70 Birch Haven Way
- 101 Colgan Ave Unit 25
- 48 Yarrow Way
- 433 Blythewood Place
- 487 Hearn Ave
- 107 Sebastopol Ave
- 588 Roseland Ave
- 2302 Squire Ln Unit 40
- 1215 Rutledge Ave
- 62 Romani Ct
- 77 Romani Ct
- 1481 Funston Dr
- 1448 Hogrefe Way
- 1469 Funston Dr
- 1501 Funston Dr
- 1444 Hogrefe Way
- 1459 Hogrefe Way
- 1490 Funston Dr
- 1482 Funston Dr
- 1441 Funston Dr
- 1451 Hogrefe Way
- 1476 Funston Dr
- 1500 Funston Dr
- 1433 Funston Dr
- 1428 Hogrefe Way
- 1435 Hogrefe Way
- 1509 Funston Dr
- 241 Santini Ct
- 1468 Funston Dr
- 235 Santini Ct
- 1429 Hogrefe Way
Your Personal Tour Guide
Ask me questions while you tour the home.